

ECG and Arrhythmias
This page covers the basics of ECG interpretation, recognition of common arrhythmias, characteristic ECG findings, clinical significance, and initial management principles for relevant rhythm disturbances.
Basic ECG Information
ECG Leads and Placement
A standard ECG records the heart’s electrical activity from 12 leads (angles), giving a 3D view:
- 6 limb leads (I, II, III, aVR, aVL, aVF) → looks at the frontal plane
- 6 chest (precordial) leads (V1-V6) → looks at the horizontal plane
However, only 10 physical electrodes are attached to the patient, the ECG machine then uses these 10 electrodes to mathematically derive 12 leads of the heart.
Limb Leads Placement
Mnemonic for limb lead electrode placement: Ride Your Green Bike (in clockwise order, starting from the right arm)
| Electrode | Colour | Placement |
|---|---|---|
| RA – Right Arm | Red | On the right wrist |
| LA – Left Arm | Yellow | On the left wrist |
| LL – Left Leg | Green | On the left ankle |
| RL – Right Leg | Black | On the right ankle |
The black electrode on the right leg is a neutral / ground electrode that does not trace any electrical activity.
In clinical practice, the limb electrodes are often not placed exactly on the wrists and ankles (as shown in textbooks). For convenience (especially in emergency or inpatient settings), they are frequently attached to the upper arms and thighs, or even on the torso.
This does not significantly alter the ECG interpretation, as long as the correct relative positioning and colour order are maintained (Red – Yellow – Green – Black in a clockwise order starting from the right arm).
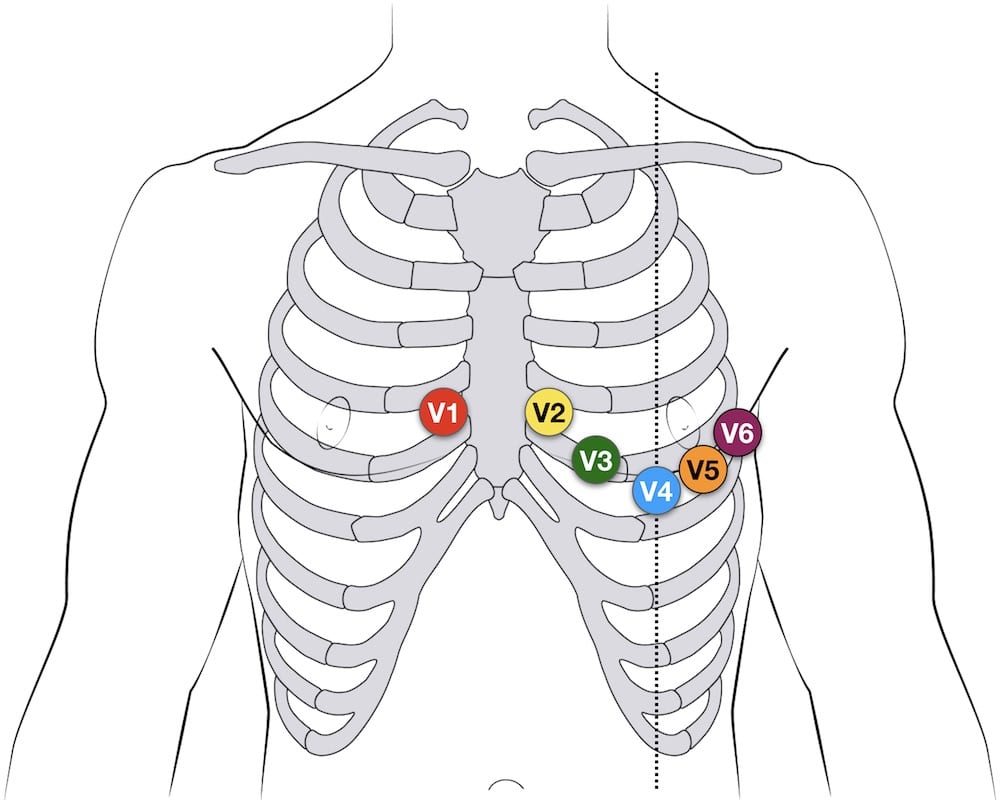
Chest Leads Placement
| Electrode | Placement Location |
|---|---|
| V1 | 4th intercostal space, right sternal border |
| V2 | 4th intercostal space, left sternal border |
| V3 | Midway between V2 and V4 |
| V4 | 5th intercostal space, mid-clavicular line |
| V5 | Same level as V4, anterior axillary line |
| V6 | Same level as V4, mid-axillary line |
Since V3 is placed midway between V2 and V4, the practical order of placing ECG leads is V1 and V2 → V4 → V3 → V5 and V6.
The correct placement of chest lead electrodes is commonly featured in both written exams and OSCEs.
https://litfl.com/12-lead-ecg-lead-placement/
© Life in the Fast Lane. Licensed under CC BY-NC 4.0
ECG Paper Basics
An ECG trace is a graph of voltage (Y-axis) against time (X-axis).
Understanding the ECG paper scale allows you to accurately measure ECG rate, intervals, and amplitudes.
Paper Speed and Calibration
| Parameter | Standard Value | Explanation |
|---|---|---|
| Paper speed | 25 mm/s | ECG paper moves 25 mm per second → 1 mm horizontally = 0.04 s |
| Voltage calibration | 10 mm = 1 mV | Standardised amplitude so 10 mm high = 1 mV (normal calibration mark at start of ECG) |
X and Y Axis Interpretation
The X (horizontal) axis on the ECG paper represents time.
| Boxes | Duration |
|---|---|
| 1 small box | 0.04 s (40 ms) |
| 1 large box (5 small boxes) | 0.20 s (200 ms) |
| 5 large boxes | 1 second |
Knowing how the boxes correspond with time is very important:
- It allows one to calculate the duration of various waveforms and intervals (see below)
- It is commonly featured in exams
The Y (vertical) axis on the ECG paper represents voltage.
| Boxes | Voltage |
|---|---|
| 1 small box | 0.1 mV |
| 1 large box (5 small) | 0.5 mV |
ECG Paper Layout
Standard 12-lead ECG has 12 simultaneous views:
- Each lead is recorded for ~2.5 sec
- Most ECGs also show a rhythm strip (usually lead II) along the bottom for ~10 sec
Assessing an ECG
When assessing an ECG, always compare it with any previous ECGs, especially when there are abnormal changes.
The following is a stepwise approach to ECG interpretation
There is no single “correct” method – most clinicians eventually develop their own preferred way to read an ECG.
This framework is provided simply as a reference to help organise the key information within each section.
1. Rhythm
Assess the rhythm by looking at the distance between R-R intervals:
- If the spacing is consistent, the rhythm is regular
- If the spacing varies, the rhythm is irregular
To effectively assess the rhythm:
- Use a scrap of paper to mark two consecutive R waves
- Then, slide the paper along the trace to see if subsequent R–R distances match
- If the R-R distances match = regular rhythm, if not = irregular rhythm
There are 3 types of rhythm patterns:
- Regular rhythm: R-R intervals are equal throughout
- Irregular rhythm can be sub-classified as following:
- Irregularly irregular: R-R intervals vary unpredictably
- Regularly irregular: R-R intervals vary, but in a predictable pattern
2. Heart Rate
Rate category:
- <60 bpm: bradycardia
- >100 bpm: tachycardia
There are 3 methods to calculate the heart rate from an ECG strip:
| Method | When to use | Steps | Examples |
|---|---|---|---|
| Rule of 300 | Only use if the rhythm is regular
This method is quickest for rough estimation but has the least precision |
|
Some choose to memorise the following instead of having to do the maths every time:
|
| Small box method | Only use if the rhythm is regular
This method has greater precision but takes time (and often requires a calculator) |
|
A regular ECG has 20 small boxes between 2 consecutive R waves
|
| 10 sec method | Only method that can be used if the rhythm is irregular (can also be used for regular rhythms) |
|
An irregular ECG has 13 R waves in the 10 sec rhythm strip
|
In practice, clinicians can often tell whether the heart rate is tachycardic or bradycardic at a glance, based on how closely the QRS complexes appear.
Most modern ECG machines also display automatically calculated values (heart rate, PR interval, QRS duration etc.), usually at the top left corner of the printout. However, these values may be inaccurate in irregular rhythms, artefacts, or lead misplacement, and older or portable ECG systems may not display them at all, requiring manual calculation.
Regardless, in exams one would be expected to calculate the heart rate manually from the ECG strip.
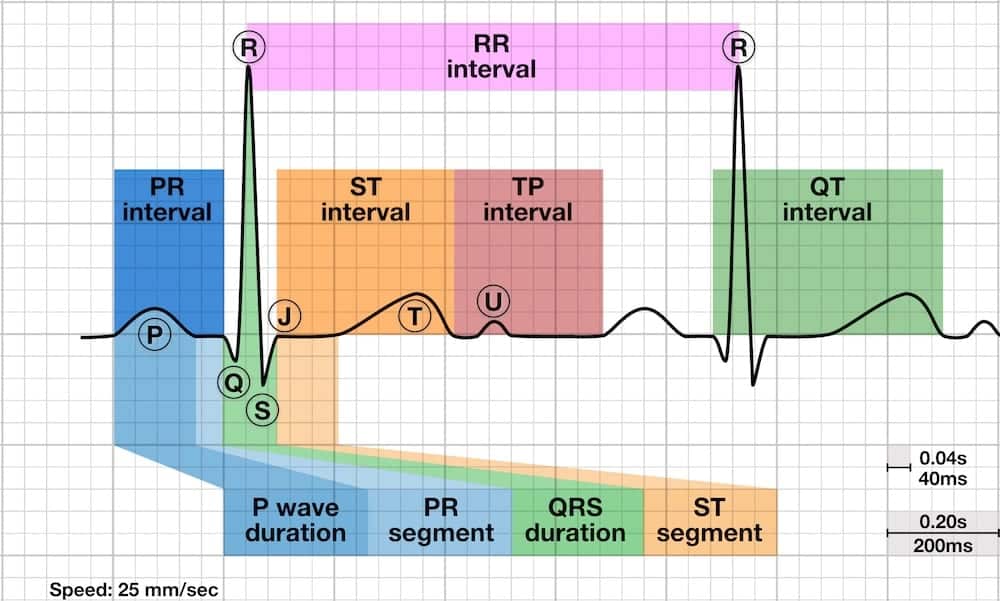
3. Waveforms, Segments, and Intervals
This illustration nicely outlines and summarises the various waveforms, segments and intervals:
https://litfl.com/p-wave-ecg-library/
© Life in the Fast Lane. Licensed under CC BY-NC 4.0
This table only included the clinically and exam-important information (e.g. extra information like normal amplitude of the waves is omitted):
| Wave / segment / interval | Definition | Underlying mechanism | Normal duration / morphology |
|---|---|---|---|
| P wave | First small +ve deflection before QRS | Atrial depolarisation |
|
| PR interval | Start of the P wave → start of QRS | Conduction through the AV node |
|
| QRS complex | Series of deflections after the PR interval
|
Overall: ventricular depolarisation
|
Not all the components of the QRS complex are always seen:
|
| ST segment | End of QRS (J point) → start of T wave | Time when the ventricles are all depolarised |
|
| T wave | Deflection after the ST segment | Ventricular repolarisation |
|
| QT interval | Start of QRS → end of T wave | Ventricular depolarisation and repolarisation | General duration:
The QT interval is inversely proportional to heart rate
**Students would generally not be expected to manually calculate the QTc interval in exams. The cutoff for normal QTc values varies depending on the source and method of calculation, so it is sufficient for exam purposes to learn a rough cutoff value, typically around 440–460 ms. If the exam question intends to indicate a prolonged QTc interval, it would usually be obvious with a clearly prolonged value such as 500 ms, rather than a borderline value like 470 ms. |
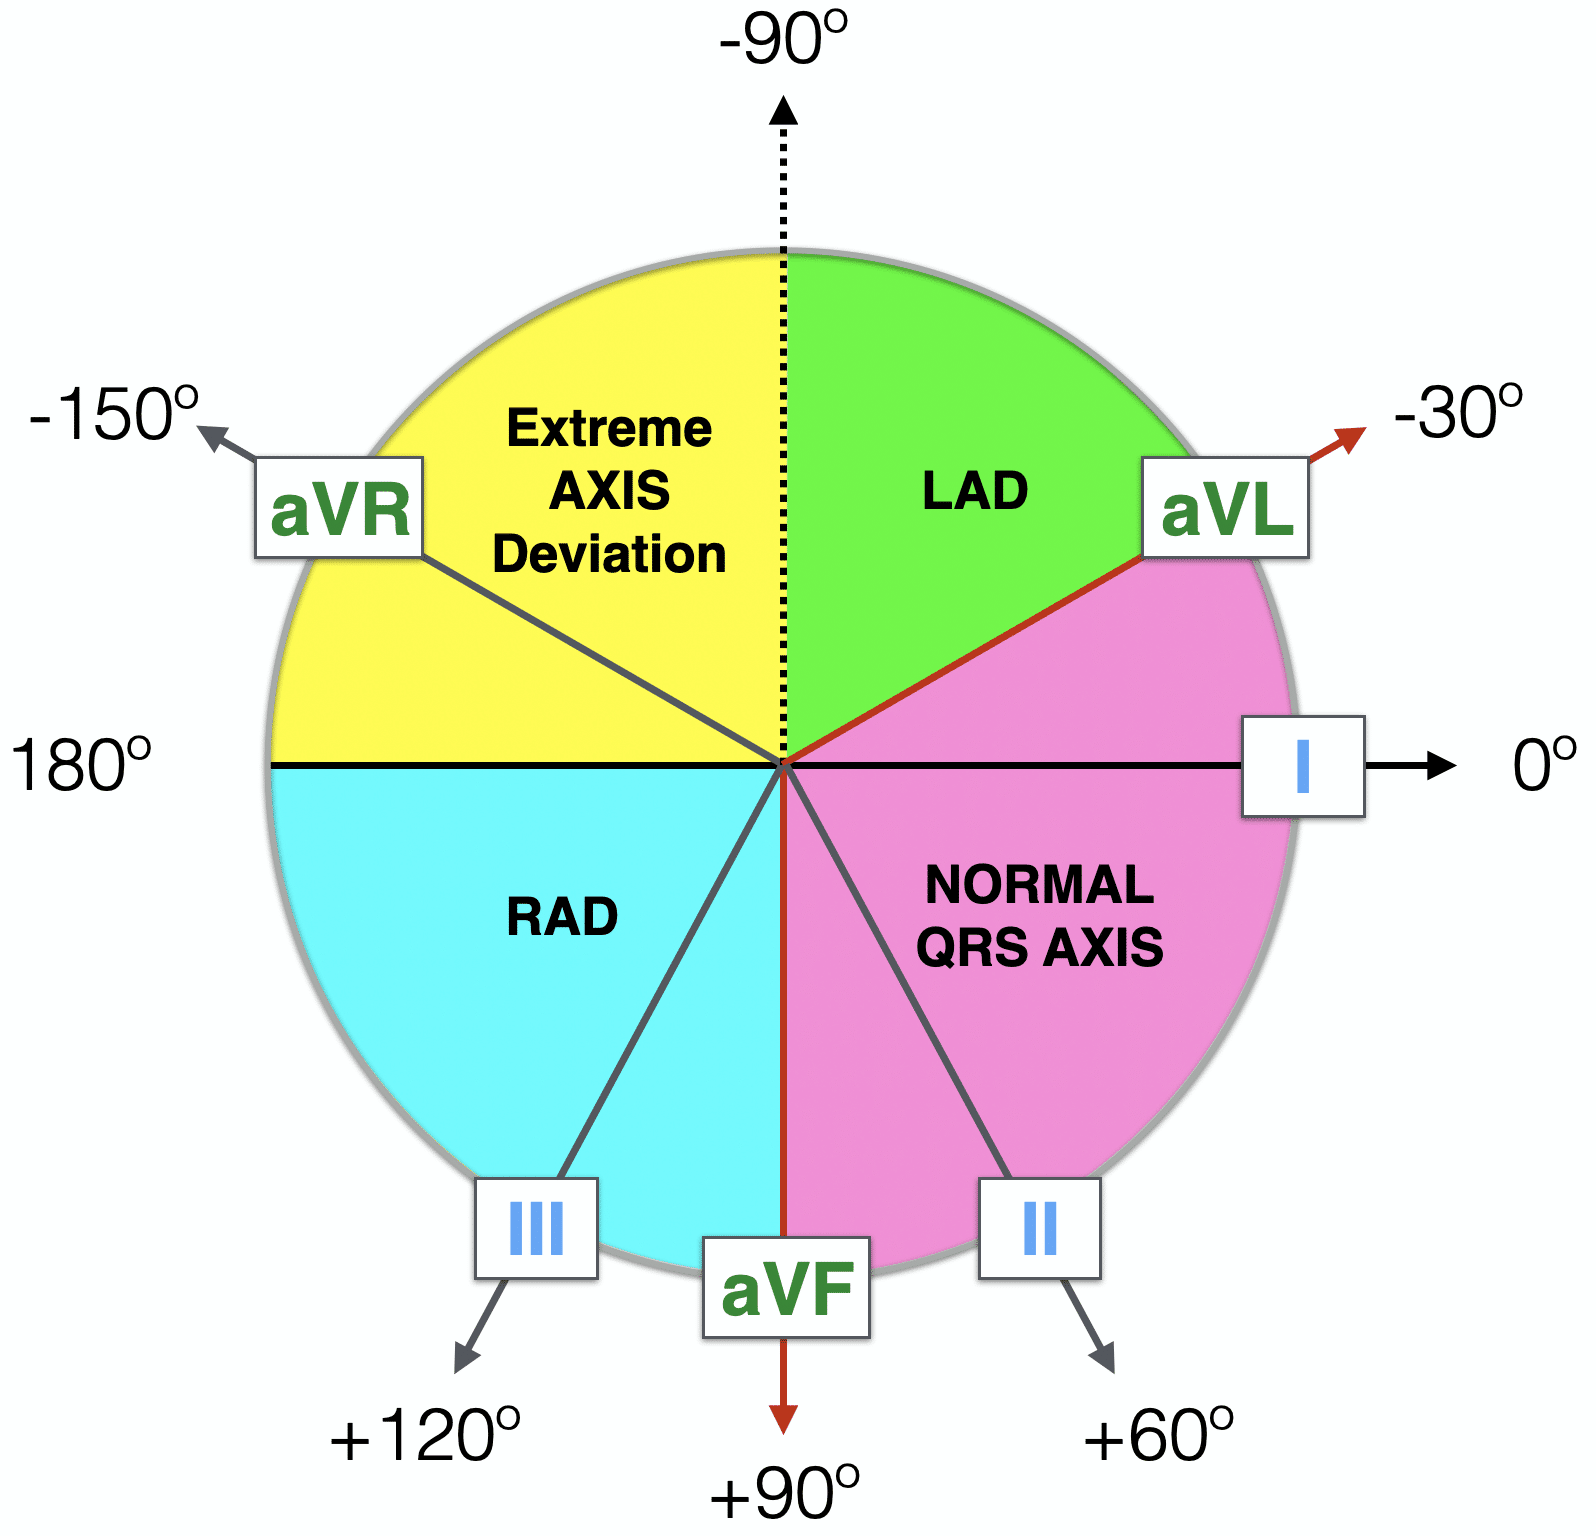
4. Axis
The cardiac axis describes the overall direction of ventricular depolarisation
- In simple terms, it tells you which way the electrical current in the heart is predominantly moving
Normal axis and axis deviations:
| Type of Axis | Angle Range (°) |
|---|---|
| Normal axis | −30° to +90° |
| Left axis deviation (LAD) | −30° to −90° |
| Right axis deviation (RAD) | +90° to +180° |
| Extreme (north-west) axis deviation | −90° to ±180° |
In practice, most modern ECG machines automatically calculate the cardiac axis. While determining the exact numerical angle requires trigonometric calculation, this is not expected in exams or clinical practice.
Instead, clinicians are generally expected to recognise whether the axis is normal or deviated, which can be quickly done using the “Thumbs Rule” described below:
-
👍 Lead I up (+ve), 👍 aVF up (+ve) → normal axis
-
👍 Lead I up (+ve), 👎 aVF down (-ve) → left axis deviation (thumbs/leads ‘Leaving’ each other → Left axis deviation)
-
👎 Lead I down (-ve), 👍 aVF up (+ve) → right axis deviation (thumbs/leads ‘Reaching’ each other → Reft axis deviation)
- 👎 Lead I down (-ve), 👎 aVF down (-ve) → extreme (north-west) axis deviation
The 4-quadrant helps visualise the axis deviation and how it corresponds with the limb leads.
https://litfl.com/ecg-axis-interpretation/
© Life in the Fast Lane. Licensed under CC BY-NC 4.0
Non-Arrhythmic ECG Abnormalities
Abnormal Wave / Interval / Segment
Abnormal ECG Waves
P Wave Abnormalities
There are 3 main P wave abnormalities:
| Abnormalities | ECG feature | Cause |
|---|---|---|
| Absent P wave | No identifiable P waves | Atrial fibrillation |
| P mitrale | Broad and notched P waves (like an “M”) | Left atrial enlargement (classically due to mitral stenosis) |
| P pulmonale | Tall, peaked P wave | Right atrial enlargement (classically due to pulmonary hypertension) |
ECG Example – Absent P Wave in Atrial Fibrillation
© Life in the Fast Lane. Licensed under CC BY-NC 4.0
ECG Example – P Mitrale
https://litfl.com/p-wave-ecg-library/
© Life in the Fast Lane. Licensed under CC BY-NC 4.0
ECG Example – P Pulmonale
https://litfl.com/p-wave-ecg-library/
© Life in the Fast Lane. Licensed under CC BY-NC 4.0
QRS Abnormalities
Key QRS abnormalities:
| Abnormalities | ECG feature | Cause |
|---|---|---|
| Wide QRS | QRS duration >3 small boxes (>120ms / 0.12s) | Bundle branch blocks (see below for more details) |
| Pathological Q wave | Q waves are considered pathological if >2 small boxes deep and >1 small box wide | Previous myocardial infarction (current myocardial infarction can also give a pathological Q wave, which then persists afterwards) |
ECG Example – Wide QRS
This left bundle branch block ECG demonstrates globally widened QRS complexes.
© Life in the Fast Lane. Licensed under CC BY-NC 4.0
ECG Example – Pathological Q Wave
This ECG demonstrates pathological Q waves in leads V1-V4 (most prominent in V1-V3), due to anterior myocardial infarction.
© Life in the Fast Lane. Licensed under CC BY-NC 4.0
T wave Abnormalities
| Abnormalities | ECG feature | Cause |
|---|---|---|
| Tall tented T wave | T waves are sharply peaked, narrow and symmetrical | Hyperkalaemia |
| Hyperacute T wave | T waves are broadly peaked and asymmetrical | Early phase of STEMI (before ST elevation appears) |
| Flat / invisible T wave | T wave amplitude is reduced (flattened) or absent | Hypokalaemia |
| Inverted T wave | T waves are inverted (deflected below the baseline) | Myocardial ischaemia (NSTEMI, unstable angina, left or right heart strain) |
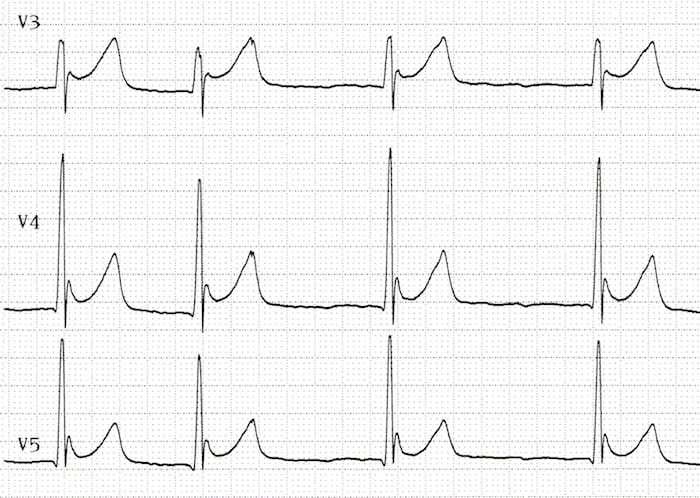
ECG Example – Tall tented T wave
This ECG demonstrates tall tented T waves (most prominent in the precordial leads), secondary to hyperkalaemia.
© Life in the Fast Lane. Licensed under CC BY-NC 4.0
ECG Example – Hyperacute T wave
This ECG demonstrates hyperacute T waves, secondary to an anterior STEMI, concurrent ST elevation is also visible.
© Life in the Fast Lane. Licensed under CC BY-NC 4.0
ECG Example – Flat / Invisible T wave
This ECG demonstrates flat / invisible T waves globally, secondary to hypokalaemia.
© Life in the Fast Lane. Licensed under CC BY-NC 4.0
ECG Example – Inverted T wave
This ECG demonstrates inverted T waves in the precordial leads, secondary to anterior NSTEMI, pathological Q waves are also visible in leads V1-V4.
© Life in the Fast Lane. Licensed under CC BY-NC 4.0
Additional Waves
The following waves are not usually seen on a normal ECG:
| Wave | ECG feature | Causes |
|---|---|---|
| U wave | Small +ve deflection after the T wave |
|
| J wave (Osborne wave) | Small +ve deflection at the J point (junction between the end of QRS and ST segment) |
|
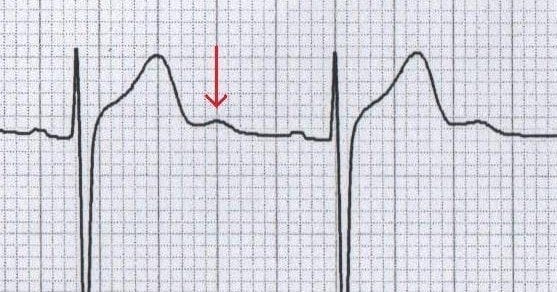
ECG Example – U Wave
Note that there is a positive deflection (arrowed) after the T wave, and before the next P wave, that is the U wave.
© Life in the Fast Lane. Licensed under CC BY-NC 4.0
ECG Example – J Wave (Osborne Wave)
A narrow notch can be seen at the J point (junction between the end of QRS and ST segment), that is the J wave. This ECG is secondary to hypothermia.
https://litfl.com/osborn-wave-j-wave-ecg-library/
© Life in the Fast Lane. Licensed under CC BY-NC 4.0
Abnormal Intervals
Main abnormal intervals to be aware of:
| Abnormalities | ECG feature | Causes |
|---|---|---|
| PR prolongation | PR interval >5 small boxes (>200ms / 0.2s) | Heart blocks |
| PR shortening | PR interval <3 small boxes (<120ms / 0.12s) | Pre-excitation syndrome (e.g. Wolff-Parkinson-White syndrome) |
| QTc prolongation | QTc >430ms in male / >450ms in female (roughly) |
|
| QTc shortening | QTc <350ms (roughly) |
|
ECG Example – PR Prolongation
This ECG demonstrates PR prolongation (PR interval is roughly 9 small boxes / 360ms), secondary to 1st degree heart block.
© Life in the Fast Lane. Licensed under CC BY-NC 4.0
ECG Example – PR Shortening
This ECG demonstrates PR shortening (PR interval is roughly 2.5 small boxes / 100ms), secondary to Wolff-Parkinson-White syndrome. Concurrent delta wave (the slurred upstroke R wave) is also visible.
https://litfl.com/wolff-parkinson-white-wpw-ecg-library/
© Life in the Fast Lane. Licensed under CC BY-NC 4.0
ECG Example – QTc Prolongation
This ECG demonstrates QTc prolongation (on the rhythm strip, one can appreciate that the end of the T wave is immediately right behind the start of the P wave). The QTc is 510ms, secondary to hypomagnesaemia.
© Life in the Fast Lane. Licensed under CC BY-NC 4.0
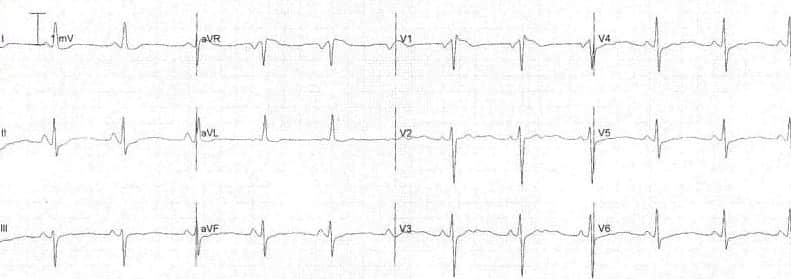
ECG Example – QTc Shortening
This ECG demonstrates QTc shortening (one can appreciate that the T wave began immediately after the QRS, and the T wave duration remains unaltered). The QTc is 260ms, secondary to hypercalcaemia.

© Life in the Fast Lane. Licensed under CC BY-NC 4.0
Axis Deviation
Causes
Main causes of left axis deviation:
| Cause | Rationale |
|---|---|
| Left ventricular hypertrophy | Excessive muscle mass in the left ventricles → more left-sided electrical activity → net left axis shift |
| Inferior / right sided MI | Inferior / right sided MI reduces viable muscle mass in the right ventricles → less right-sided electrical activity → more (relative) left-sided electrical activity → net left axis shift |
| Diaphragmatic elevation (e.g. pregnancy, obesity, ascites) | Diaphragm pushes the heart upwards → heart’s physical orientation is more left, relative to the ECG leads → net left axis shift |
| Left anterior fascicular block | Left anterior fascicle of the left bundle branch fails to conduct → ventricular depolarisation is spread left and downward via the posterior fascicle → net left axis shift |
Main causes of right axis deviation:
| Cause | Rationale |
|---|---|
| Right ventricular hypertrophy | Excessive muscle mass in the right ventricles → more right-sided electrical activity → net right axis shift |
| Anterior / lateral MI | Anterior / lateral MI reduces viable muscle mass in the left ventricles → less left-sided electrical activity → more (relative) right-sided electrical activity → net right axis shift |
| Chronic lung conditions (→ cor pulmonale) | There is right ventricular hypertrophy/strain in cor pulmonale → more right-sided electrical activity → net right axis shift
This also applies to any cause of acute right heart strain (e.g. pulmonary embolism) |
| Children / young patients | Due to the relative size and orientation of the ventricles (more right-sided) |
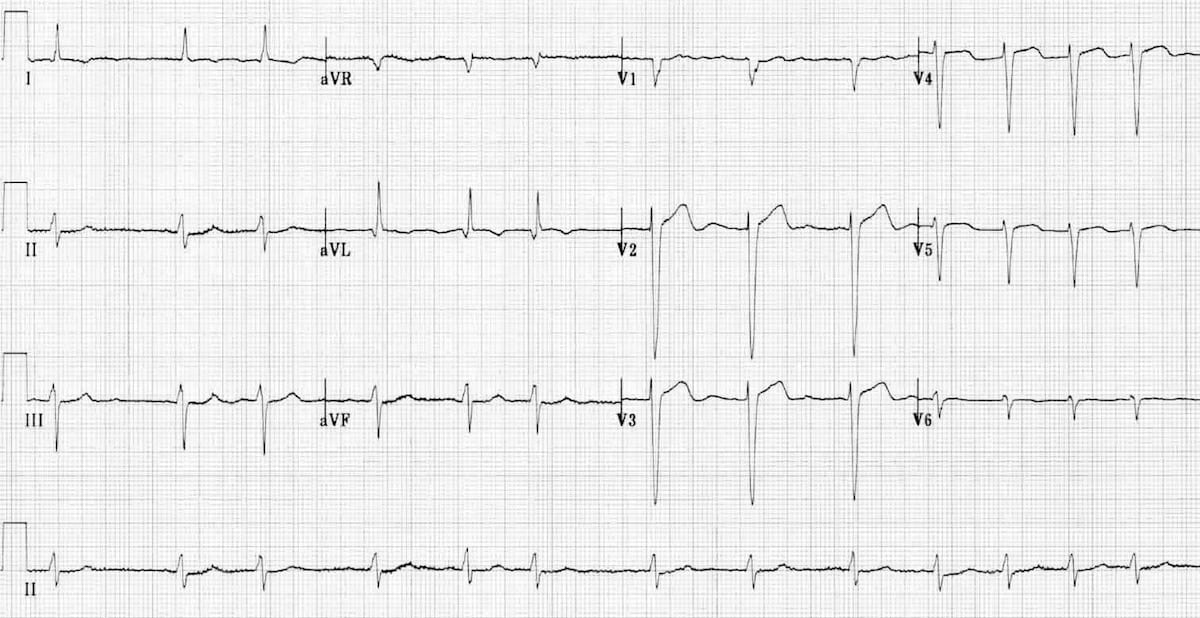
ECG Examples
Remember, the Thumb rule is helpful to work out the cardiac axis, by just looking at 2 leads:
-
👍 Lead I up (+ve), 👍 aVF up (+ve) → normal axis
-
👍 Lead I up (+ve), 👎 aVF down (-ve) → left axis deviation
-
👎 Lead I down (-ve), 👍 aVF up (+ve) → right axis deviation
- 👎 Lead I down (-ve), 👎 aVF down (-ve) → extreme (north-west) axis deviation
This ECG shows left axis deviation. Applying the thumb rule: lead I is up (+ve) and lead aVF is down (-ve). The left axis deviation is secondary to left ventricular hypertrophy.
© Life in the Fast Lane. Licensed under CC BY-NC 4.0
This ECG shows right axis deviation. Applying the thumb rule: lead I is down (-ve) and lead aVF is up (+ve). The right axis deviation is secondary to right ventricular hypertrophy (from cor pulmonale).
https://litfl.com/top-100-ecg-cases/
© Life in the Fast Lane. Licensed under CC BY-NC 4.0
Tachyarrhythmias
For the management of tachyarrhythmias, see this article.
Tachyarrhythmias can be broadly categorised into atrial and ventricular arrhythmia (by the anatomical origin of electrical impulses).
Atrial Arrhythmias
Atrial Fibrillation (AF)
AF is one of the most commonly encountered arrhythmias in both clinical practice and exams. See this article for information beyond ECG features.
Atrial fibrillation is characterised by:
- Rapid, disorganised electrical activity in the atria from multiple foci
- → Irregularly ventricular contraction
Key ECG features of AF:
- Invisible P waves
- Irregularly irregular rhythm
- Narrow QRS (unless aberrancy is present)
- Heart rate can vary
- Untreated AF often presents as fast AF (rate >100 bpm)
- However, it is common for AF to have a normal heart rate, esp. if on treatment
- Slow AF (rate <100 bpm) is less common
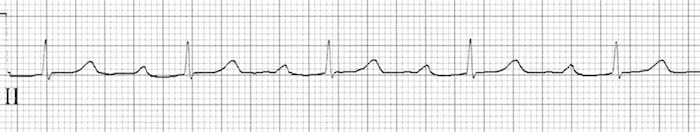
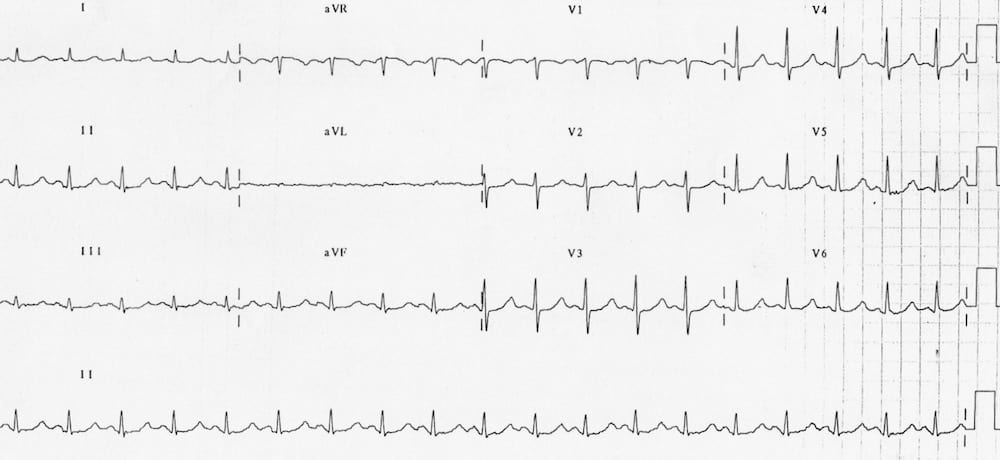
This is an ECG of atrial fibrillation. Note the irregularly irregular rhythm in the rhythm strip, no discrete P waves are seen before each QRS.
© Life in the Fast Lane. Licensed under CC BY-NC 4.0
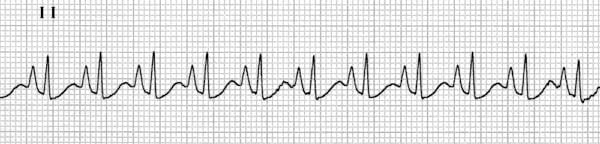
Atrial Flutter
Atrial flutter is caused by a single macro re-entry circuit within the right atrium → regular, rapid ventricular contraction
Key ECG features of atrial flutter:
- Regular, narrow complex tachycardia
- Flutter waves are visible instead of normal P waves → classic sawtooth pattern of flutter waves (best seen in inferior leads)
- Heart rate is very rapid and predictable (R-R intervals are multiples of P-P interval)
- Most common: 2:1 atrial flutter (only 1 in every 2 atrial impulses is conducted to the ventricles) → ~150bpm
- 1:1 atrial flutter → ~300bpm (rare)
- 3:1 → ~100 bpm
- 4:1 → ~75 bpm
However, atrial flutter can have variable blocks (unpredictable conduction of atrial impulses to the ventricles), giving an irregular narrow complex tachycardia. This is mentioned for completeness’s sake and is unlikely to be examined
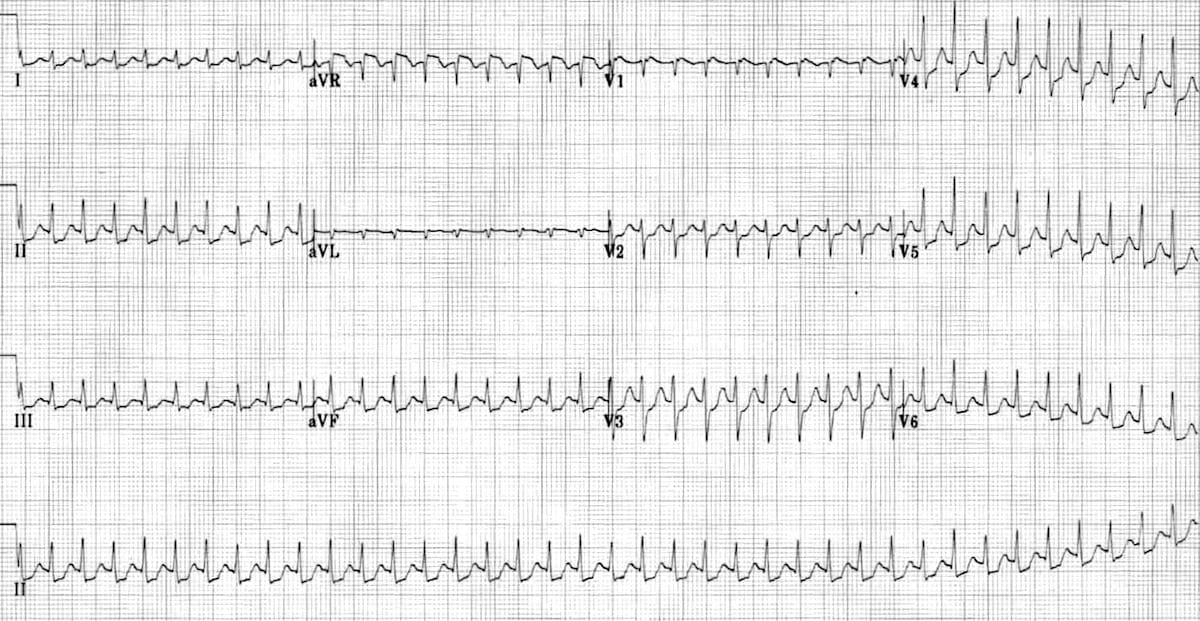
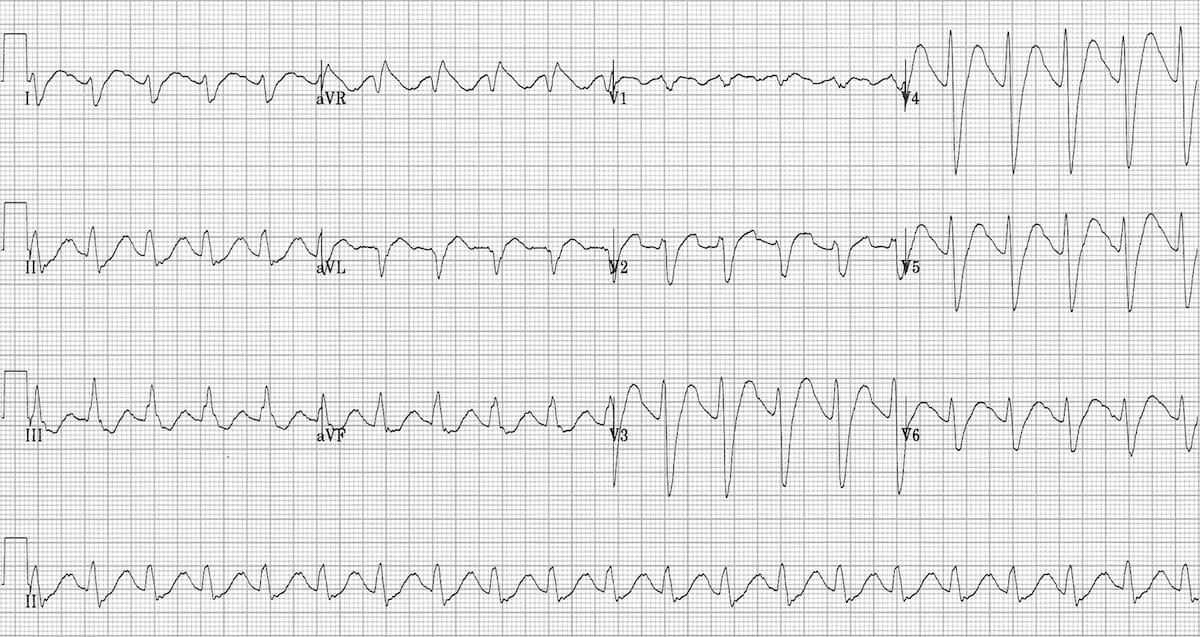
This is an ECG of atrial flutter with 2:1 block. Note the regular narrow complex tachycardia and heart rate of 150bpm. Flutter waves are highly visible in the inferior leads (II, III, aVF).
Supraventricular Tachycardia (SVT)
The term and concept of SVT often create a lot of confusion:
- Anatomically speaking, SVT refers broadly to any arrhythmia originating above the ventricles (including AF and atrial flutter)
- However, clinically, SVT is used to describe a specific group or regular, narrow complex tachycardia
- Atrioventricular nodal re-entrant tachycardia (AVNRT) – most common
- Atrioventricular re-entrant tachycardia (AVRT)
- Atrial tachycardia
Pathophysiology of he 3 main SVTs:
| SVT Type | Pathophysiology |
|---|---|
| Atrioventricular nodal re-entrant tachycardia (AVNRT)* | Presence of a micro-reentrant circuit (that has a slow and fast pathway) within or near the AV node, causing rapid ventricular contraction. |
| Atrioventricular re-entrant tachycardia (AVRT)* | Presence of an accessory pathway that creates a macro-reentrant circuit involving both the AV node and the accessory pathway connecting the atria and ventricles.
This circuit allows electrical impulses to continuously loop between the atria and ventricles thus rapid ventricular contraction. |
| Atrial tachycardia | Focus of abnormal automaticity or micro-reentry within atrial tissue, outside of the AV node |
*The electrophysiology of AVNRT goes beyond what is described (e.g. subtypes of AVNRT and AVRT depending on the direction of the circuit). This information is omitted as it is very advanced knowledge and will almost certainly not be examined in the UKMLA.
SVTs have similar ECG features:
- Regular, narrow complex tachycardia
- Heart rate is usually 150-250 bpm
It is not possible to definitively distinguish between AVNRT, AVRT, and atrial tachycardia solely based on the surface ECG, this differentiation typically requires electrophysiology studies.
In exams, students are generally not expected to differentiate precisely between AVNRT, AVRT, and atrial tachycardia. Being able to distinguish between atrial fibrillation, atrial flutter, and SVT is usually sufficient. Be aware that the SBA option may specify AVNRT instead of SVT, understanding that AVNRT is the most common form of SVT will allow selection of the correct answer.
The author acknowledges that there are ANRT / AVRT / atrial tachycardia-specific ECG features, but they are omitted.
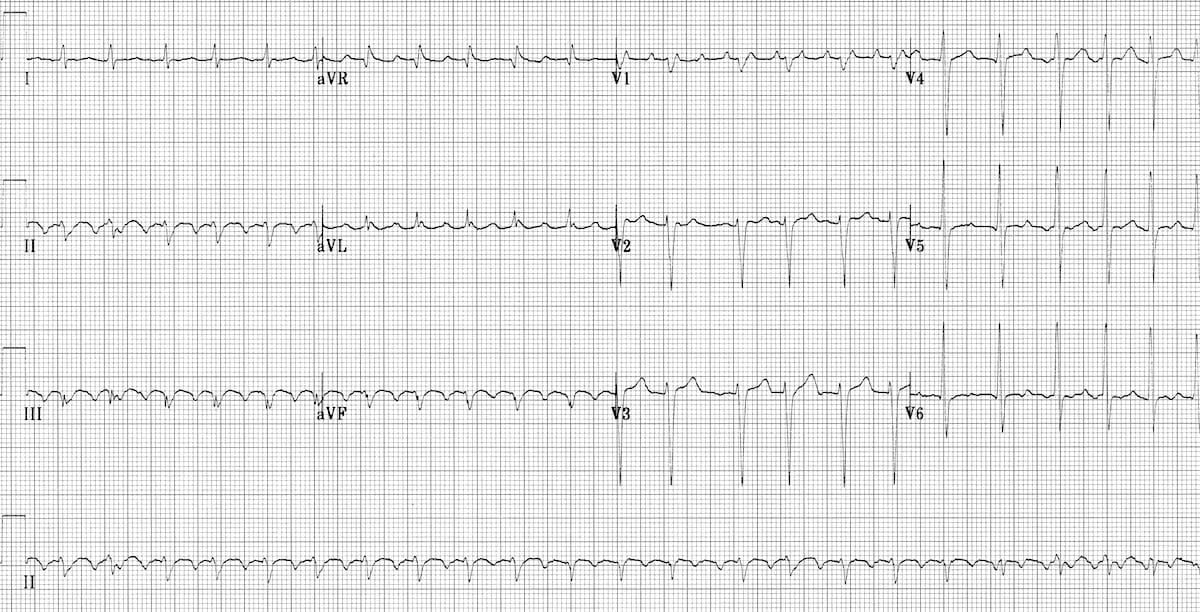
This is an ECG of SVT (specifically AVNRT). Note that regular, narrow complex tachycardia. Heart rate is roughly ~220 bpm. There are no signs of atrial fibrillation or atrial flutter, therefore it’s safe to consider this as SVT.
https://litfl.com/atrioventricular-nodal-re-entry-tachycardia-avnrt-ecg-library/
© Life in the Fast Lane. Licensed under CC BY-NC 4.0
Wolf-Parkinson-White Syndrome (WPW syndrome)
WPW syndrome is a congenital conduction disorder characterised by the presence of an accessory pathway (bundle of Kent) that directly connects the atria to the ventricles, bypassing the normal AV node and bundle of His conduction system
- The accessory pathway allows pre-excitation of the ventricles, meaning that part of the ventricular myocardium is activated earlier than usual because the electrical impulse bypasses the AV node and travels down this accessory pathway
- WPW syndrome is technically not a tachyarrhythmia itself, but it can contribute to the development of atrioventricular re-entrant tachycardia (AVRT) – if the accessory pathway participates in a reentrant circuit
ECG features:
- Short PR interval (<3 small boxes) – due to early conduction of the electrical impulse from the atria to the ventricles via the accessory pathway
- Delta wave (a slurred, slow initial upstroke of the R wave) – due to the pre-excitation of the ventricles
- Wide QRS interval (>3 small boxes) – due to fusion of pre-excitation and normal conduction
1st line definitive management: catheter ablation of the accessory pathway
- A very dangerous complication is if a patient with WPW develops atrial fibrillation
- The accessory pathway in WPW can conduct the very rapid atrial impulses directly to the ventricles without the usual AV node delay, significantly increasing the risk of ventricular fibrillation
This is an ECG of WPW syndrome. The above-described ECG changes can be seen clearly in lead II.
https://litfl.com/top-100-ecg-cases/
© Life in the Fast Lane. Licensed under CC BY-NC 4.0
Ventricular Arrhythmias
Premature Ventricular Complex (PVCs) / Ventricular Ectopics / Ventricular extrasystoles
PVCs arise when a ventricular focus becomes electrically active earlier than the sinus node, leading to an ectopic ventricular beat that occurs independently of the normal electrical conduction system.
- Since the impulse is generated by a ventricular focus and NOT conducted via the normal bundle of His conduction system, it gives an abnormal ECG morphology compared to the “normal” QRS complexes
ECG features:
- Broad QRS (>3 small boxes)
- Premature (the beat occurs earlier than would be expected for the next sinus impulse)
- Abnormal morphology
- Unusual overall shape that differs from the normal QRS complexes (the shape depends on the origin)
- Discordant ST-segment and T-wave changes
- PVCs can be classified based on their repeating pattern
- Bigeminy: every other beat is a PVC
- Trigeminy: every third beat is a PVC
- Quadrigeminy: every fourth beat is a PVC
- Couplet: two consecutive PVCs
- Non-sustained ventricular tachycardia: 3-30 consecutive PVCs (lasting <30 sec)
A key point is that these PVC ECG features are not seen globally across the entire ECG. Usually, there is just one or a few PVCs among the normal heartbeats. So, if there is a grossly normal ECG with a few “weird” QRS complexes, think PVC.
For instance, in LBBB there are wide abnormal-looking QRS complexes as well, however they are seen throughout the entire ECG.
This is an ECG of bigeminy PVCs. Each normal beat is followed by a PVC.
© Life in the Fast Lane. Licensed under CC BY-NC 4.0
This is an ECG of PVC couplets. The PVCs come in pairs (2 conductive ones).
© Life in the Fast Lane. Licensed under CC BY-NC 4.0
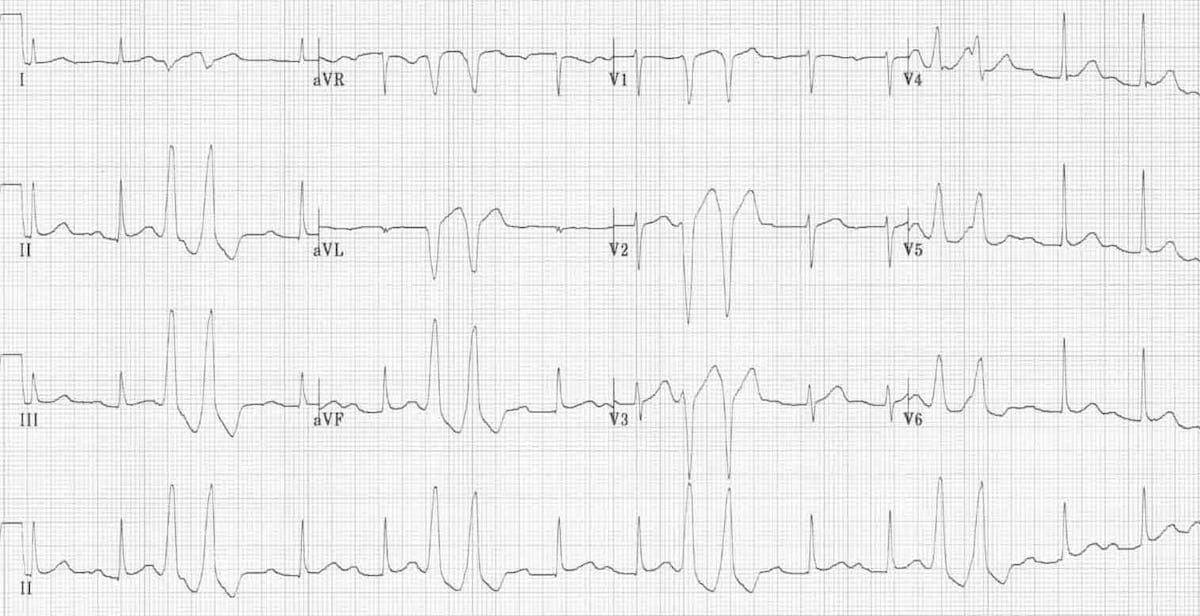
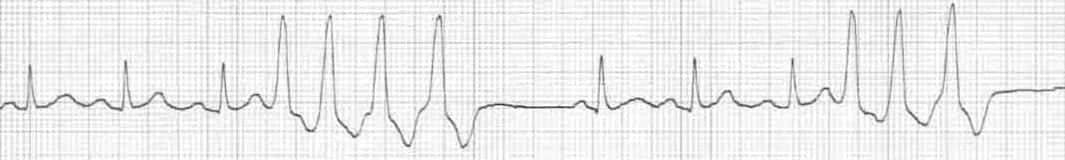
This is an ECG of non-sustained ventricular tachycardia. There are 4 consecutive PVCs, then 3 consecutive PVCs.
© Life in the Fast Lane. Licensed under CC BY-NC 4.0
Ventricular Tachycardia (VT)
Be aware that VT without a pulse is a shockable cardiac arrest rhythm. Treat accordingly to the ALS algorithm, see this article.
However, VT can also be with a pulse. In that case, treat accordingly to the peri-arrest tachycardia algorithm, see this article.
VT is a tachyarrhythmia that originates from the ventricles, defined by ≥3 consecutive PVCs at a rate of >100 bpm
- VT occurs when abnormal electrical impulses arise from ventricular tissue, either due to reentry, abnormal automaticity, or triggered activity
- The classic cause is a re-entrant circuit that forms around scarred myocardium (e.g. in MI), leading to rapid activation of the ventricles
Classification of VTs:
- Sustained vs non-sustained
- Sustained VT: lasts >30 sec
- Non-sustained VT: lasts <30 sec (3-30 consecutive PVCs)
- Monomorphic vs polymorphic
- Monomorphic VT: all QRS have the same shape (as they originate from the same ventricular focus / circuit)
- Polymorphic VT: there are >1 QRS shapes (as they originate from different ventricular foci / circuits)
Torsade de pointes (TdP) is a specific type of polymorphic VT that occurs in the context of QTc prolongation.
ECG features:
- Regular, broad complex tachycardia is VT until proven otherwise (at least for medical students and non-specialists…)
- There are specific ECG features that suggest VT over other causes, but they are of excessive detail
- TdP has a varying QRS morphology and the QRS complexes appear to be “twisting” around the isoelectric line
This is an ECG of monomorphic VT. Note the very regular, broad complex tachycardia and the same QRS morphology throughout.

https://litfl.com/ventricular-tachycardia-ecg-library/
© Life in the Fast Lane. Licensed under CC BY-NC 4.0
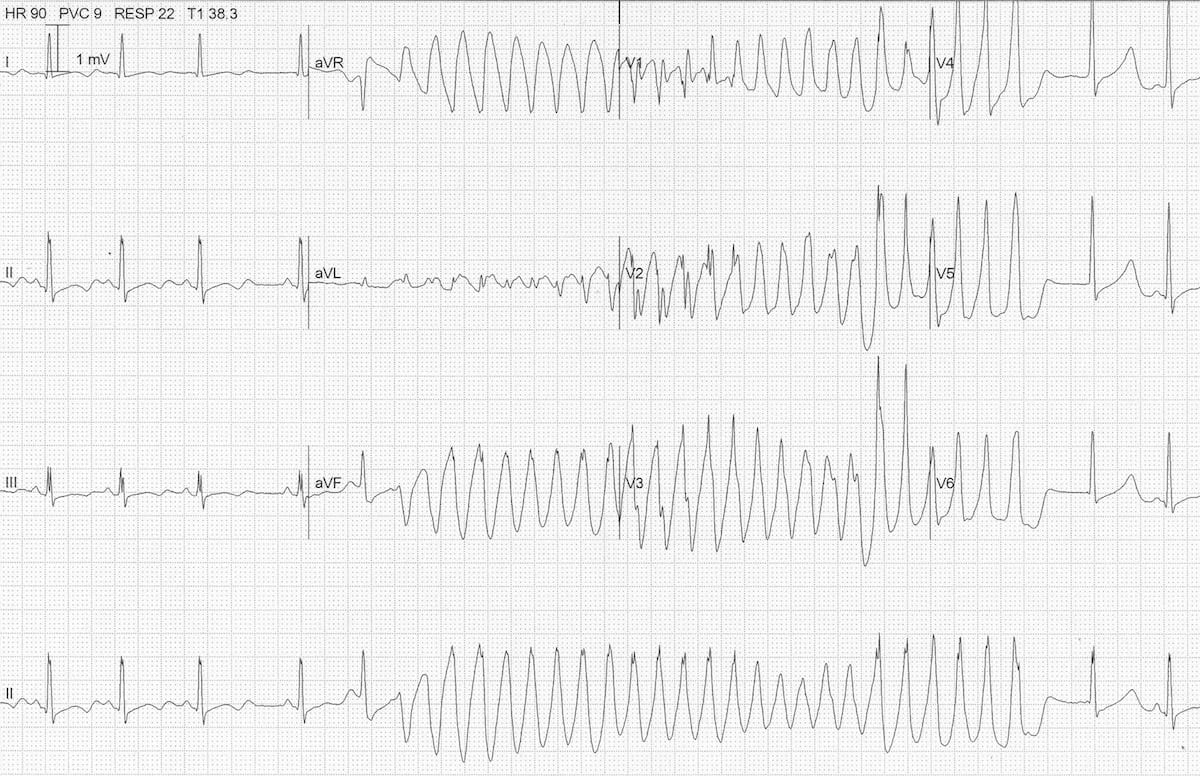
This is an ECG of polymorphic VT (specifically, Torsades de Pointes – a type of polymorphic VT). The varying QRS morphology can be appreciated, with the characteristic morphology of QRS complexes “twisting” around the isoelectric line.
https://litfl.com/torsades-de-pointes-ecg-library/
© Life in the Fast Lane. Licensed under CC BY-NC 4.0
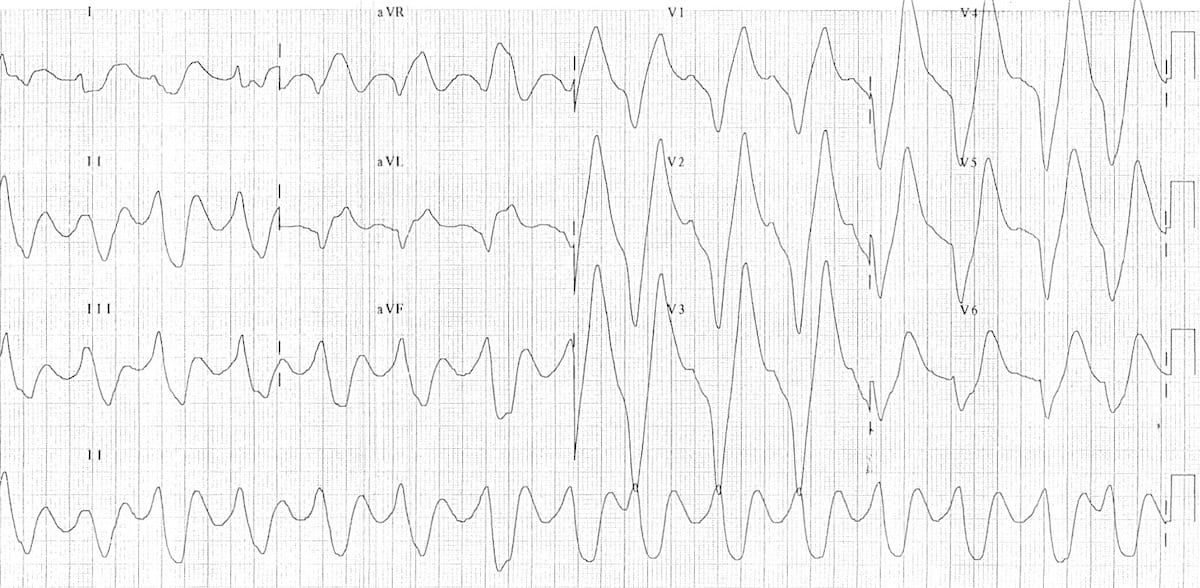
Ventricular Fibrillation
VF is a shockable cardiac arrest rhythm. Treat accordingly to the ALS algorithm, see this article.
VF is characterised by the ventricles quivering in a rapid, irregular, and disorganised manner instead of contracting effectively.
ECG features:
- Chaotic irregular deflections of varying amplitude
- No identifiable P / QRS / T waves
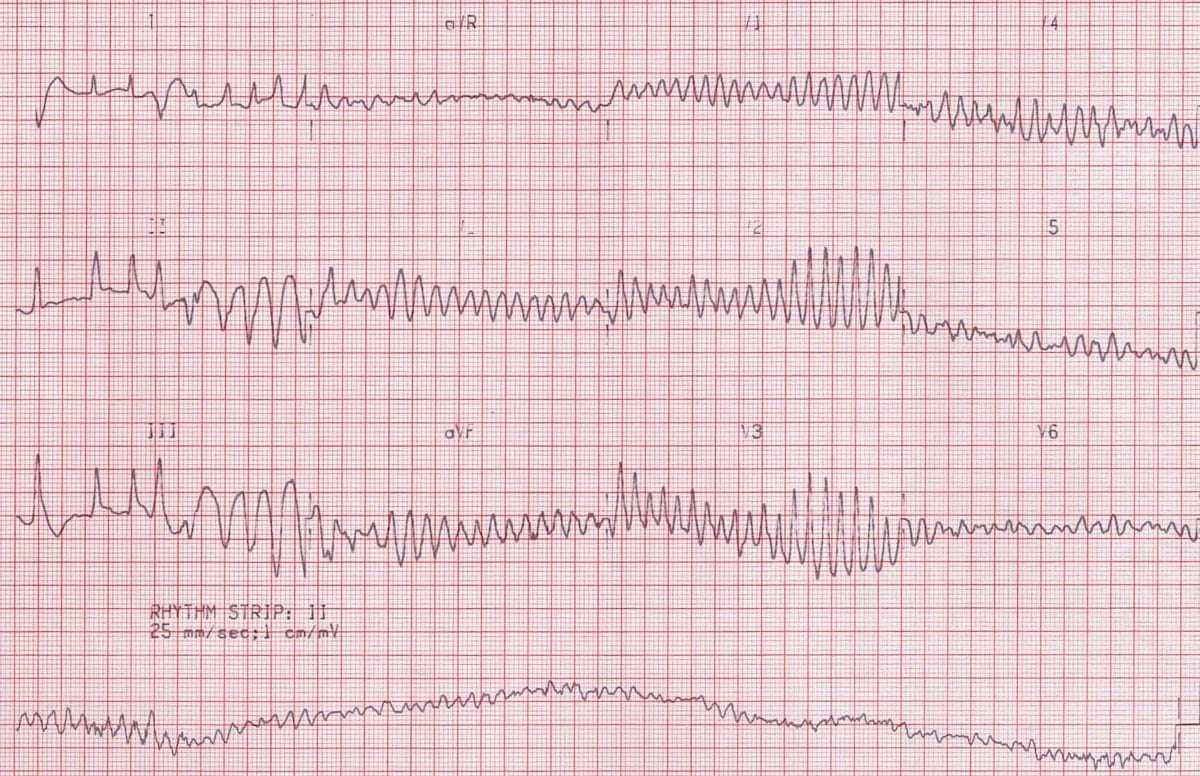
This is an ECG of VF. Note that it looks very chaotic, and no waveforms or patterns can be identified.
https://litfl.com/ventricular-fibrillation-ecg-library/
© Life in the Fast Lane. Licensed under CC BY-NC 4.0
Bradyarrhythmias
Heart Blocks / AV Blocks
Heart block occurs when electrical conduction from the atria to the ventricles is delayed or completely blocked.
There are 3 different types of heart block.
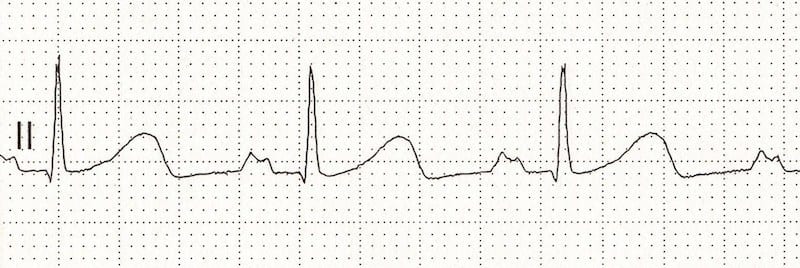
1st Degree Heart Block
ECG feature:
- PR interval consistently prolonged (>5 small squares)
- Each P wave is always followed by a QRS
This is an ECG of 1st degree heart block. In lead II, the PR interval is consistently prolonged (~7 small boxes / 280ms). Each P wave is followed by a QRS complex.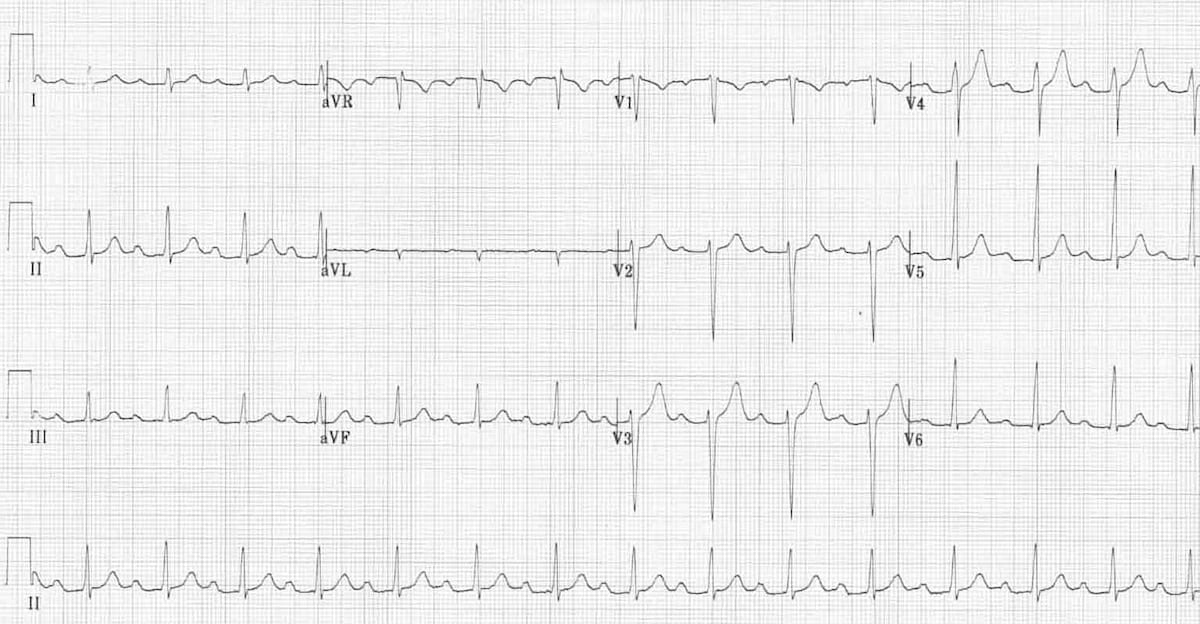
2nd Degree Heart Block
There are 2 subtypes of 2nd degree heart block:
| Type | ECG feature |
|---|---|
| Mobitz I (Wenckebach) | Progressive PR prolongation, until a non-conducted P wave (dropped QRS)
|
| Mobitz II (Hay) | Intermittently non-conducted P waves
|
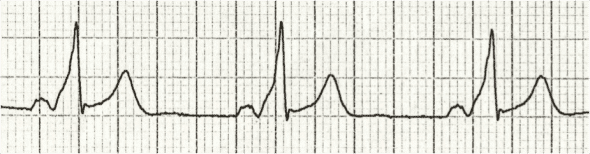
This is an ECG of a 2nd degree, Mobitz I heart block. Appreciate the progressive PR prolongation (marked by the arrow), then a non-conducted P wave (dropped QRS). Afterwards, the same cycle begins with progressive PR prolongation, until a non-conducted P wave.
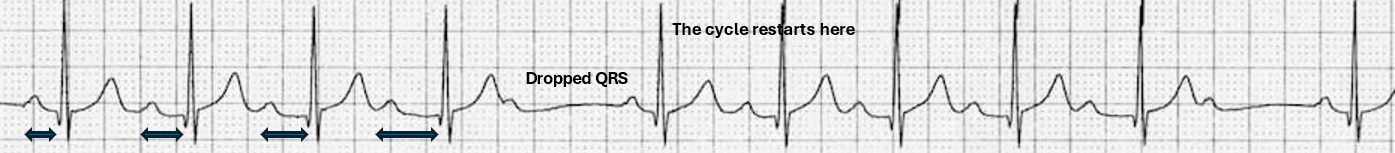
https://litfl.com/second-degree-heart-block-mobitz-i-wenckebach-ecg-library/
© Life in the Fast Lane. Licensed under CC BY-NC 4.0
This is an ECG of 2nd degree, Mobitz II heart block. The vertical arrows indicate the non-conducted P wave (dropped QRS), and note the constant PR interval throughout.
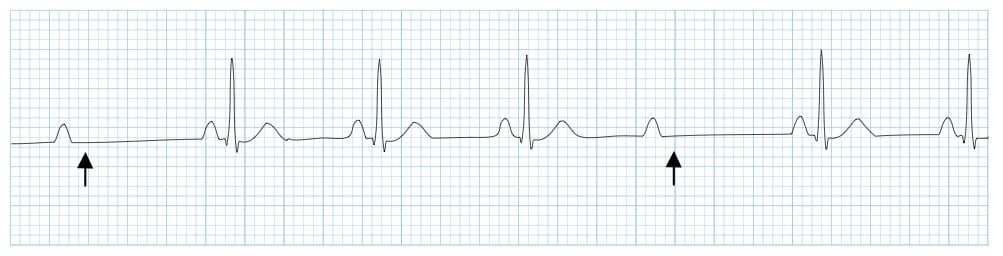
Image source: LITFL ECG Library – Mobitz II (Hay) Second-Degree AV Block. https://litfl.com/second-degree-heart-block-mobitz-ii-ecg-library/ © Life in the Fast Lane. Licensed under CC BY-NC 4.0
3rd Degree / Complete Heart Block
ECG features:
- AV dissociation
- Atrial activity (i.e. P wave) and ventricular activity (i.e. QRS) are independently regular, but there are no association between P wave and QRS (normally, each P wave is followed by QRS)
- Severe bradycardia (the ventricles have a slow intrinsic pacing rate)
This is an ECG of a 3rd-degree / complete heart block. Note the lack of association between the P waves (marked by upward-pointing arrow) and QRS (marked by downward-pointing arrow). While atrial activity (P waves) is occurring regularly, and ventricular activity (QRS) is occurring regularly.
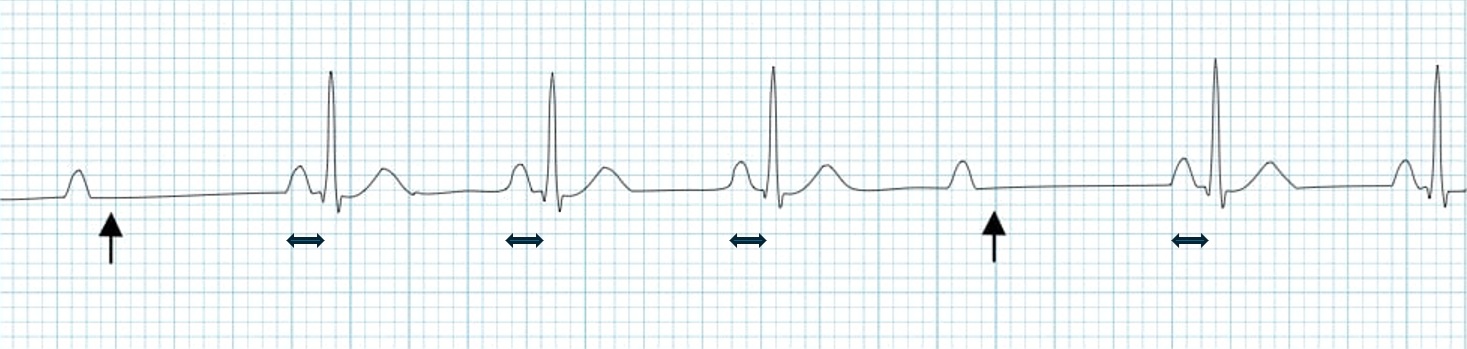
https://litfl.com/third-degree-heart-block-complete-heart-block-ecg-library/
© Life in the Fast Lane. Licensed under CC BY-NC 4.0
Junctional Rhythm
Junctional rhythm is characterised by a rhythm that originates near or within the AV node
ECG features:
- Narrow QRS (as the rhythm originates from above the ventricles, and is conducted through the normal His-Purkinje system)
- Absence / inverted P waves
- Heart rate varies depending on the origin of the impulse
- Junctional bradycardia <40 bpm
- Junctional escape rhythm 40-60 bpm
- Accelerated junctional rhythm 60-100 bpm
- Junctional tachycardia >100 bpm
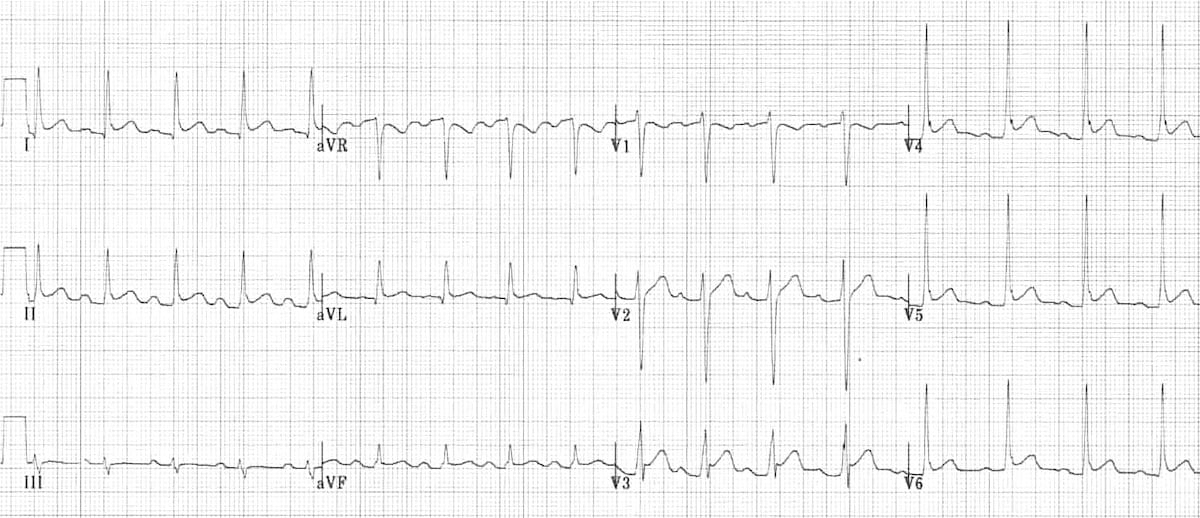
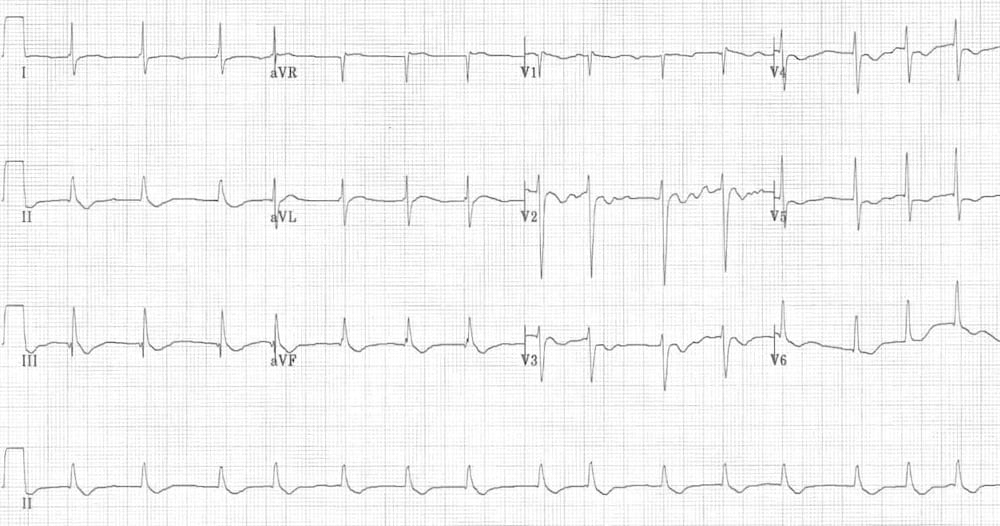
This is an ECG of an accelerated junctional rhythm. One can appreciate the narrow QRS and inverted P waves. Heart rate is ~120bpm.

https://litfl.com/junctional-rhythm-ecg-library/
© Life in the Fast Lane. Licensed under CC BY-NC 4.0
Bundle Branch Blocks (BBBs)
Apart from LBBB and RBBB, there are also other types of BBBs (e.g. left anterior fascicular block, left posterior fascicular block, bifascicular block, trifascicular block), but they are very unlikely to be examined in the UKMLA.
LBBB is by far the most important one to recognise.
Left Bundle Branch Block (LBBB)
ECG features:
- Wide QRS (>3 small boxes)
- -ve QRS in V1 (dominant S wave)
- +ve QRS in V6, classically notched like an M (dominant R wave)
- Discordant ST-segment and T-wave changes
New-onset LBBB + clinical features of myocardial ischaemia are equivalent to STEMI.
But also make sure to compare with any previous ECGs to check whether it is a new-onset or not.
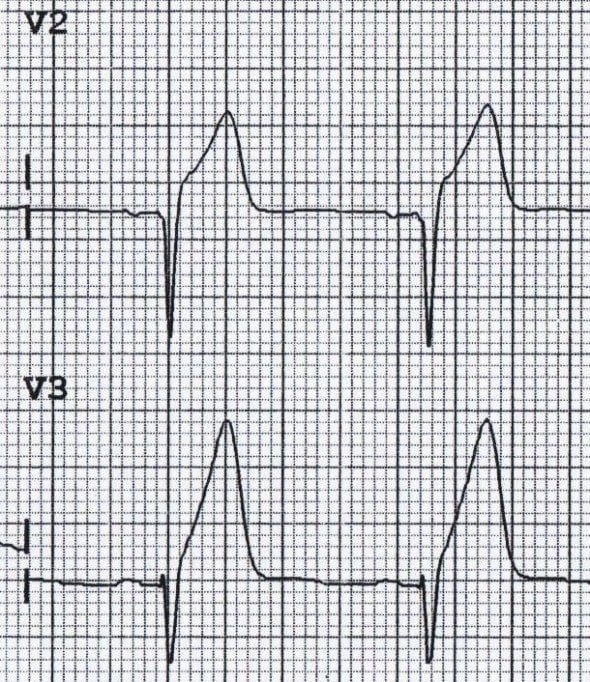
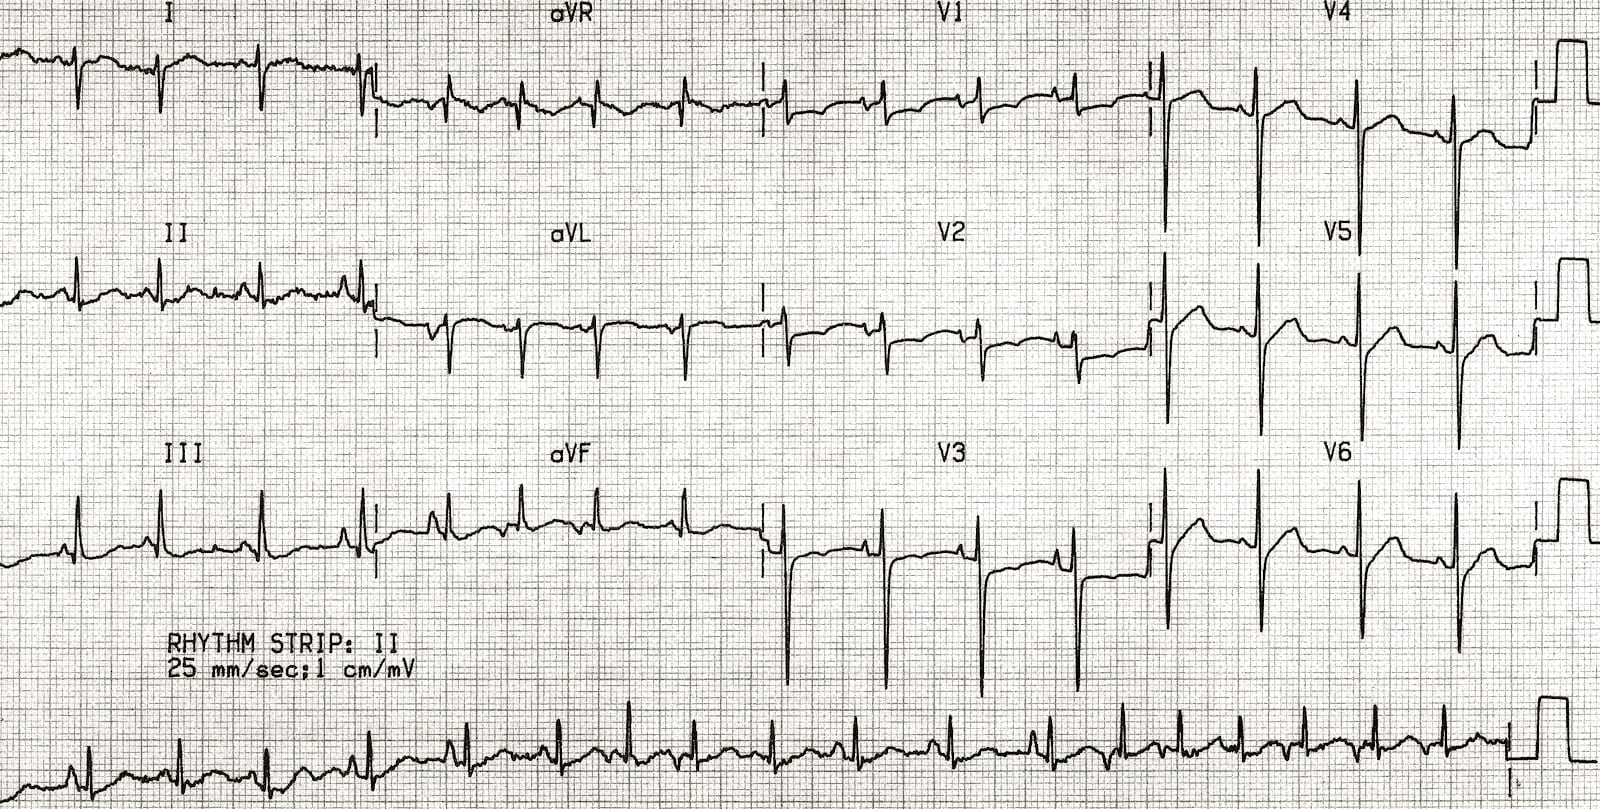
This is an ECG of LBBB. First, note the widened QRS complex across all leads. Second, a deep S wave is seen in V1 along with a dominant R wave in V6. Third, discordant changes are best seen in V1, where there is ST elevation and upright T wave while the QRS is -ve (dominant S wave).
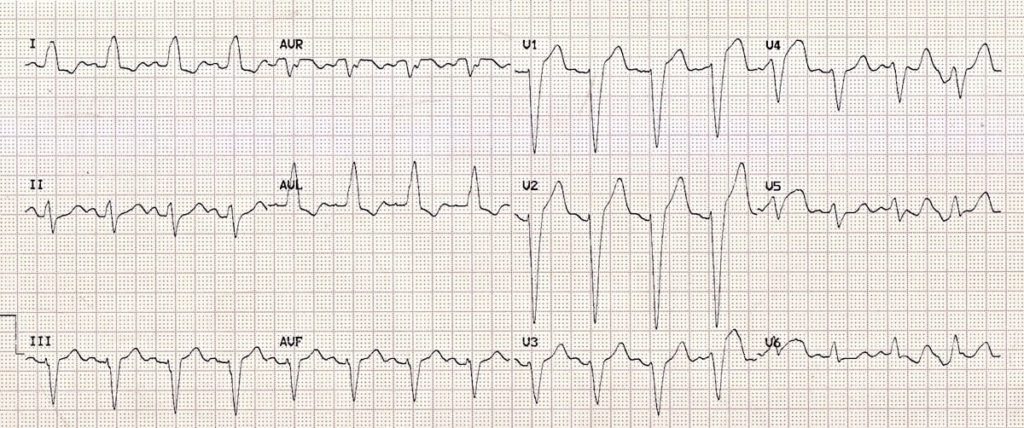
© Life in the Fast Lane. Licensed under CC BY-NC 4.0
Right Bundle Branch Block (RBBB)
ECG features:
- Wide QRS (>3 small boxes)
- +ve QRS in V1, classically notched like an M (dominant R wave)
- Wide slurred S wave in V6
- Discordant ST-segment and T-wave changes
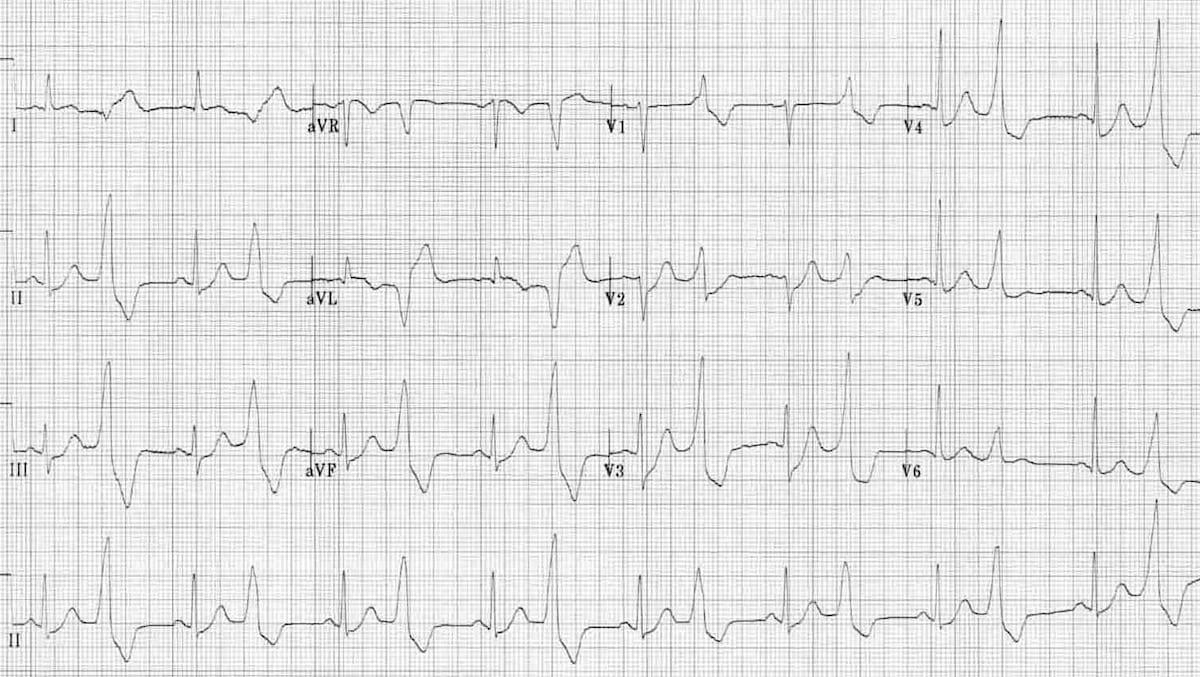
This is an EGG of RBBB. First, note the widened QRS complex across all leads. Second, an M-shaped +ve QRS in V1 along with a wide slurred S wave in V6. Third, discordant changes are best seen in V1, where there is T wave inversion while the QRS is +ve (dominant R wave).

© Life in the Fast Lane. Licensed under CC BY-NC 4.0
Myocardial Infarction
ECG Leads and Corresponding Myocardial Territory
This mapping allows localising specific areas of myocardial ischemia or infarction based on the changes in corresponding ECG leads.
| ECG Leads | Myocardial Territory | Coronary Artery Supply |
|---|---|---|
| II, III, aVF | Inferior wall | Right coronary artery (RCA) |
| V1-V4* | Anterior wall | Left anterior descending artery (LAD) |
| V5, V6, I, aVL | Lateral wall | Left circumflex artery (LCx) |
*Some sources make the distinguishment between V1-V2 (septal wall) and V3-V4 (anterior wall), however they are both supplied by the LAD, such distinguishment does not make a huge clinical difference.
ECG Examples
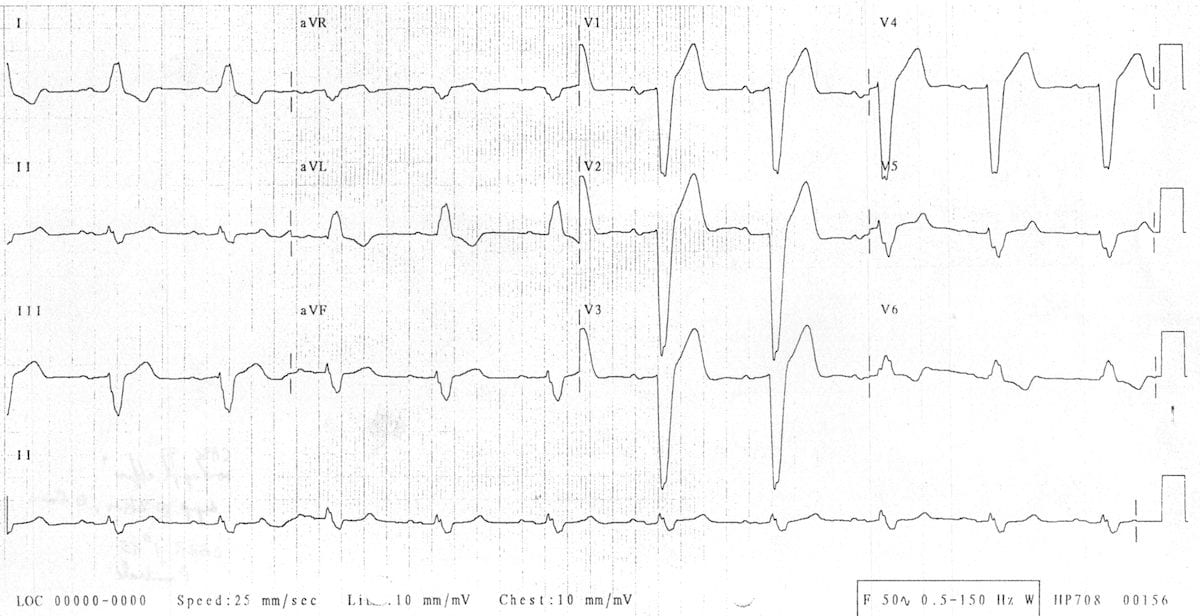
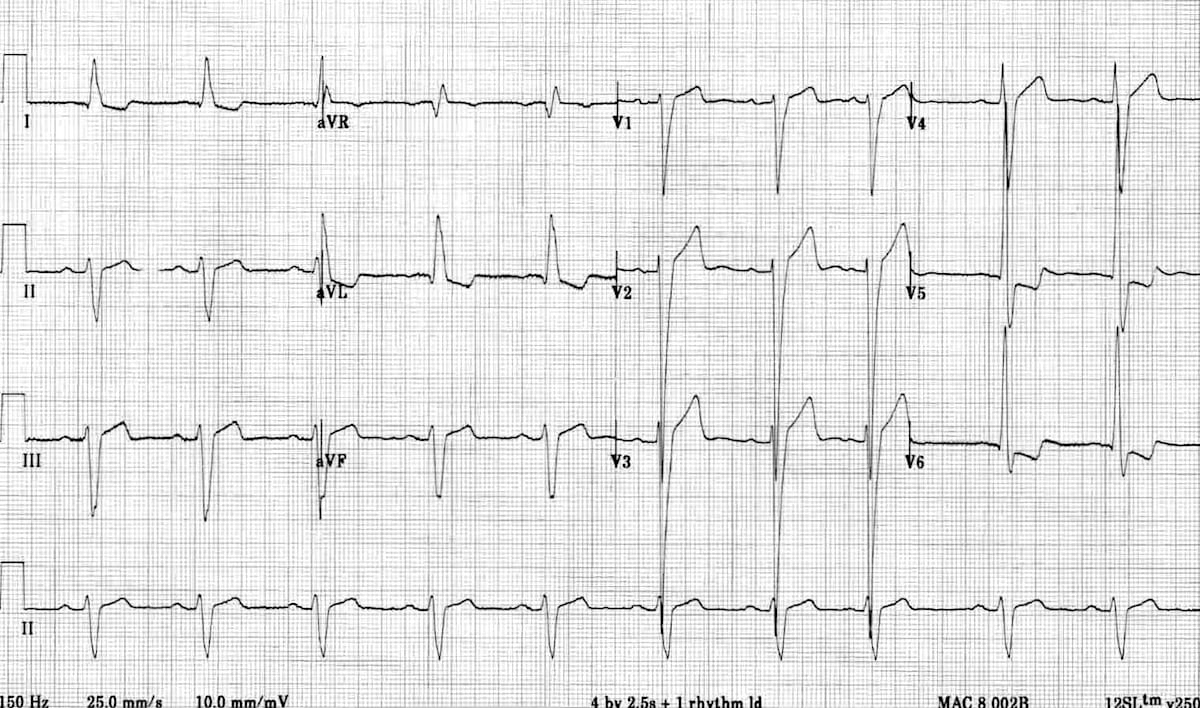
Antero-lateral STEMI
ST elevation can be clearly seen in V2-V4 and V5, V6, I, and aVL. This corresponds to the myocardial territory of the anterior and lateral wall.
© Life in the Fast Lane. Licensed under CC BY-NC 4.0
Inferior STEMI
ST elevation can be clearly seen in leads II, III, aVF. This corresponds to the myocardial territory of the inferior wall.
https://litfl.com/inferior-myocardial-infarction-ecg-library/
© Life in the Fast Lane. Licensed under CC BY-NC 4.0
Other ECG Changes
Acute Pericarditis
See this article for more details.
ECG features:
- Diffuse concave ST elevation
- Global PR depression
- Reciprocal changes in aVR and V1 (ST depression and PR elevation)
- Spodick’s sign (downsloping TP segment)
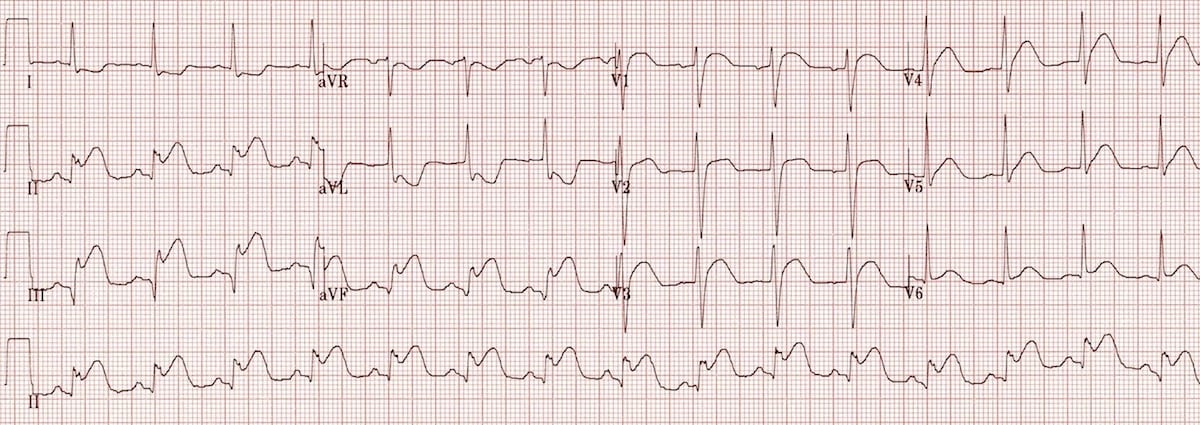
This is an ECG of acute pericarditis, widespread concave ST elevation can be seen (most obvious in precordial leads, I, II, and aVL). PR depression can also be seen (most obvious in lead I, V2, V3).
© Life in the Fast Lane. Licensed under CC BY-NC 4.0
Pulmonary Embolism (PE)
ECG features:
- Sinus tachycardia – the most common abnormality
- Right axis deviation
- Right ventricular strain pattern
- T wave inversion in V1-V4 (right precordial leads) +/- II, III, aVF (inferior leads)
The classic textbook S1Q3T3 pattern (deep S wave in lead 1, Q wave in lead III, and inverted T wave in lead III) is only seen in 20% cases of PE and is neither sensitive nor specific for PE.
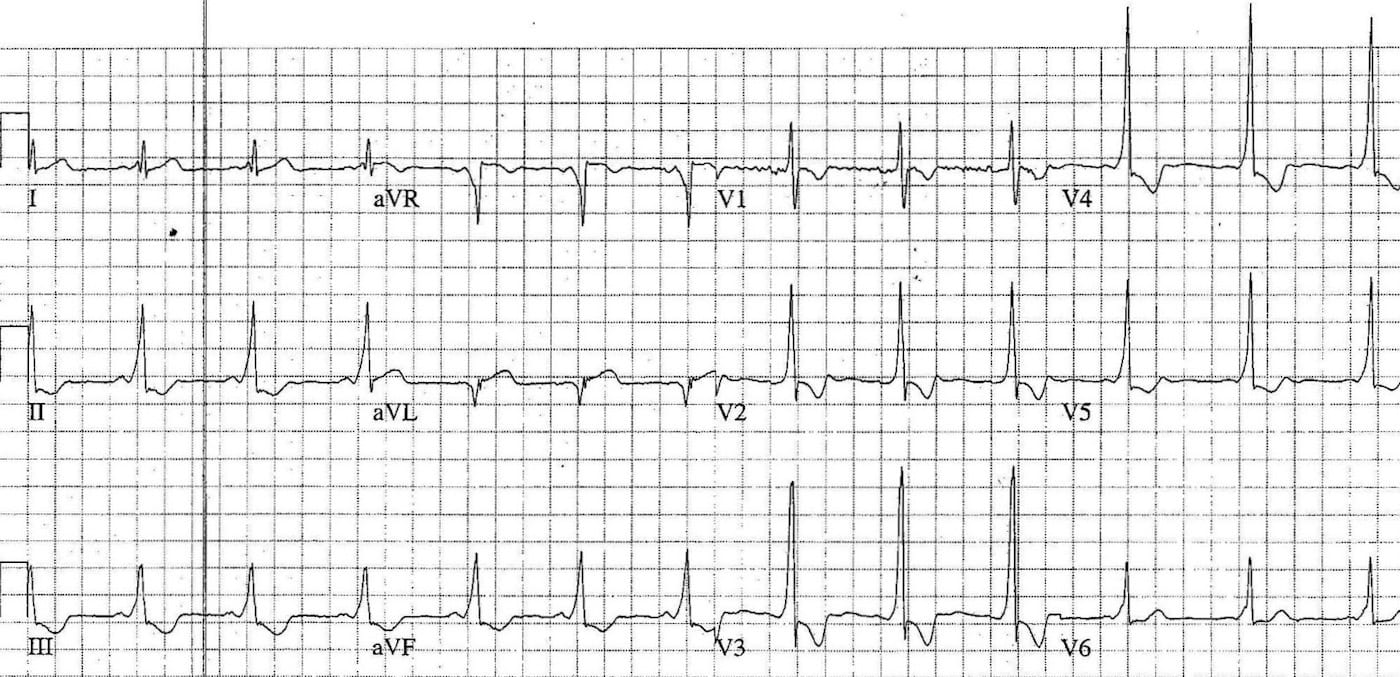
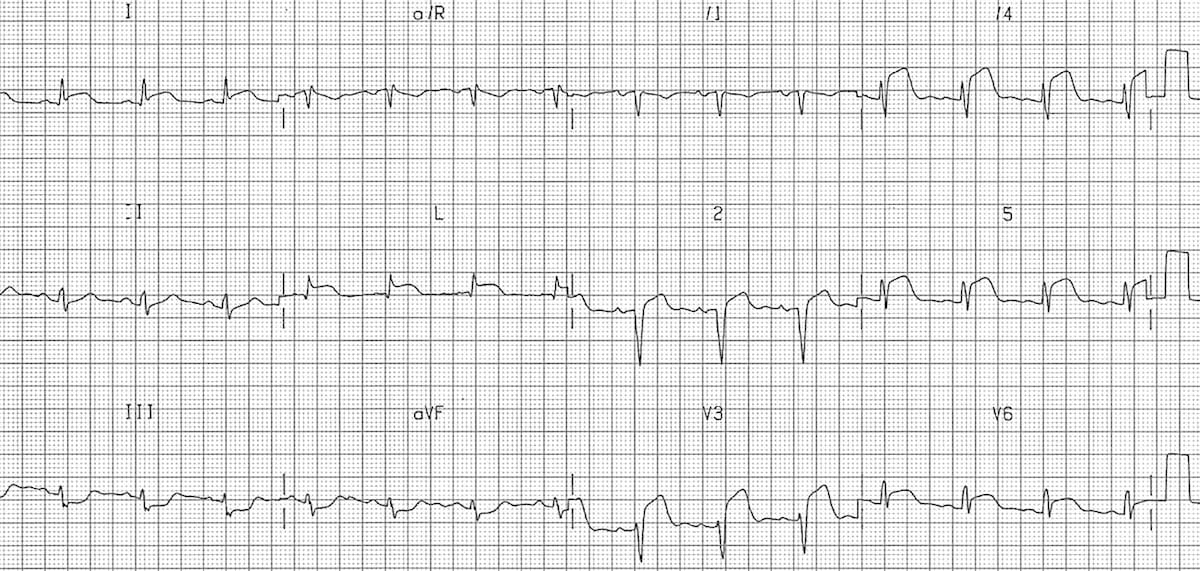
This ECG shows features suggestive of PE. Sinus tachycardia is present (rate 100 bpm). There is clear T wave inversion in right precordial leads (V1-V4) and in inferior leads (II, III, aVF). S1Q3T3 pattern is also present.
https://litfl.com/pulmonary-embolism-ecg-library/
© Life in the Fast Lane. Licensed under CC BY-NC 4.0
Cardiac Pacing (Pacemakers)
The key ECG feature is the presence of pacing spikes (sharp, narrow vertical lines) before P wave and/or QRS complexes
- The exact ECG finding in those with pacemakers may vary depending on whether intrinsic electrical activity is sensed or not, and the type of pacemaker, but this level of detail would not be necessary for the UKMLA.
This is an ECG of dual-chamber pacing. Pacing spikes can be seen consistently before both P waves (which are tiny) and QRS.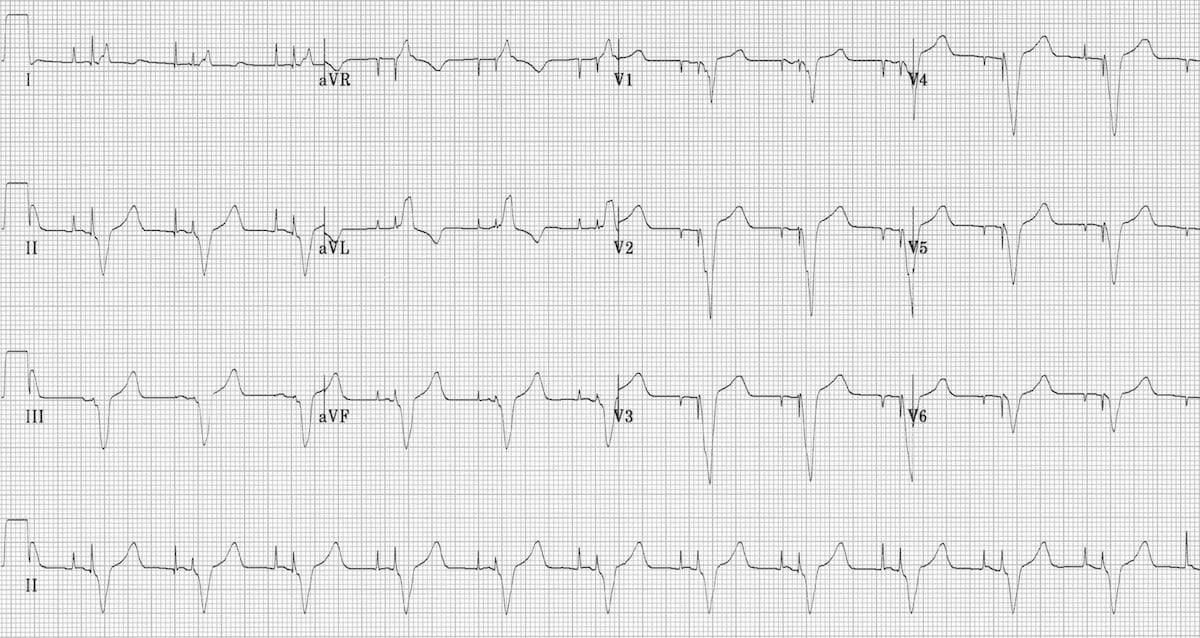
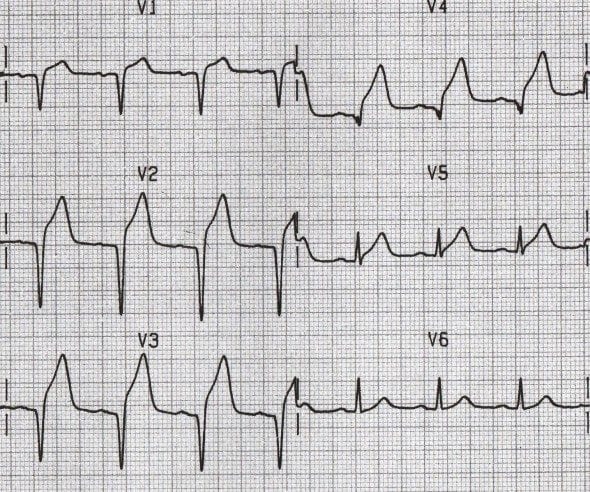
Left Ventricular Hypertrophy (LVH)
ECG feature:
- Deep S wave in V1 + tall R wave in V5 / V6 (cut-off shuod be >35 mm / 7 large boxes)
- Left axis deviation
At a glance, the QRS in LVH has very high voltages, often overlapping across leads.
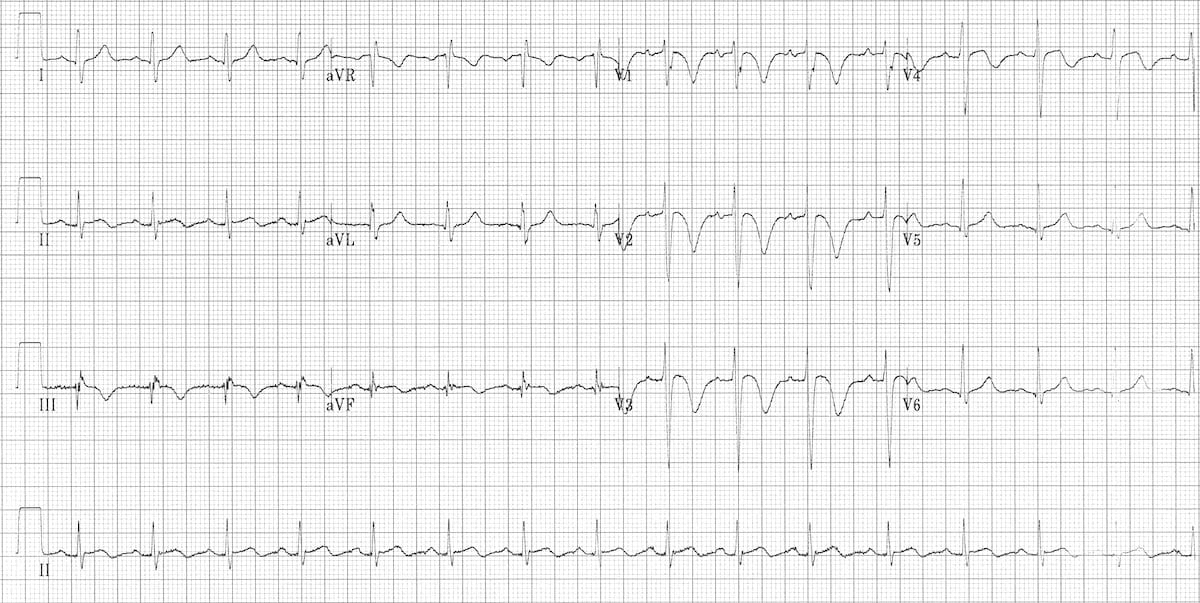
This is an ECG of LVH. Very deep S waves can be seen in V1-V3, with very tall R waves in V4-V6.
© Life in the Fast Lane. Licensed under CC BY-NC 4.0
Electrolyte Imbalance
Be aware that sodium disturbances (both hyponatraemia and hypernatraemia do not cause specific ECG changes, unlike other electrolyte imbalances (potassium, calcium, magnesium)
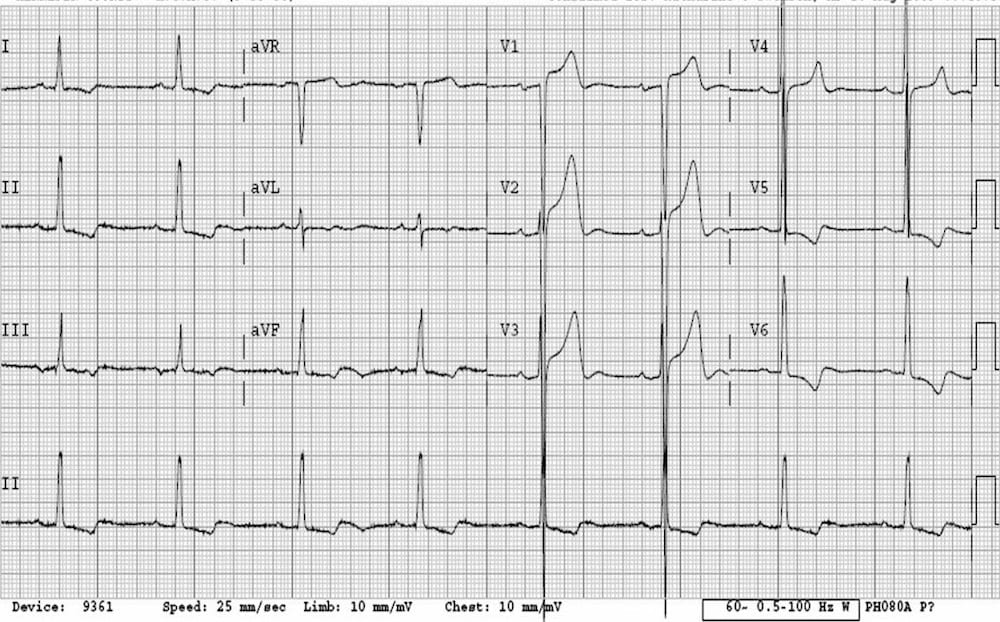
Hyperkalaemia
It is very important to recognise ECG changes in hyperkalaemia, see this article for more details.
Progressive ECG changes seen in hyperkalaemia:
| Associated potassium levels | ECG changes |
|---|---|
| ≥6.0 mmol/L |
|
| ≥6.5 mmol/L |
|
| ≥7.0 mmol/L |
|
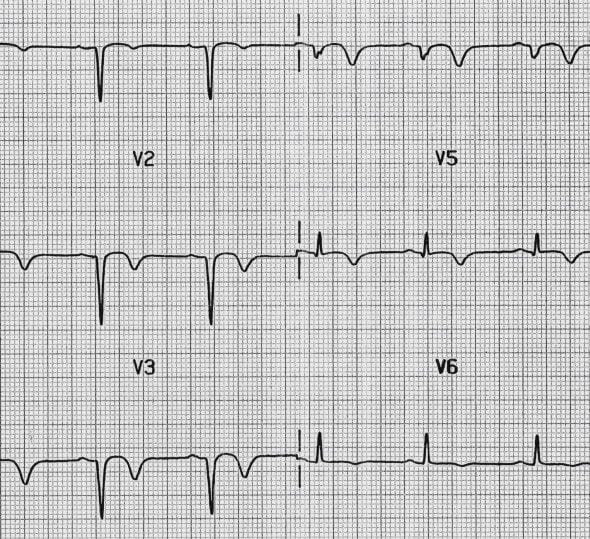
This ECG shows hyperkalaemia. Tall, tented T waves are best seen in V2-V5. There are no identifiable P waves and the QRS is starting to widen.
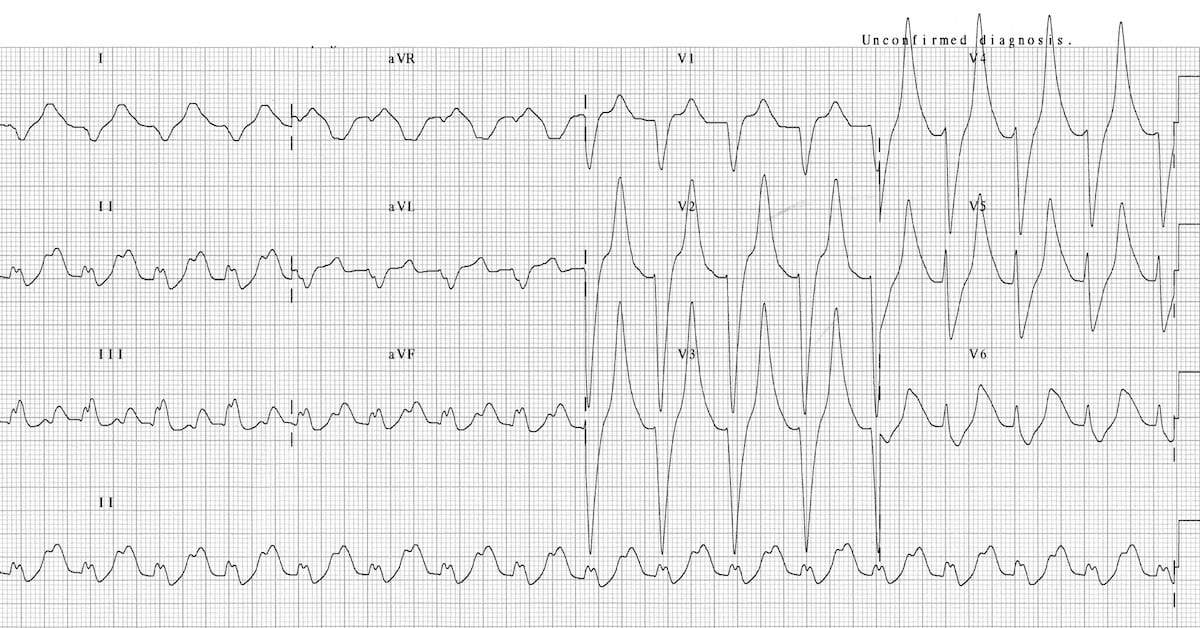
© Life in the Fast Lane. Licensed under CC BY-NC 4.0
This ECG shows very severe hyperkalaemia, with tall, tented T waves, and severe QRS widening, resembling a sine wave.
© Life in the Fast Lane. Licensed under CC BY-NC 4.0
Hypos (Hypokalaemia, Hypocalcaemia, Hypomagnesaemia)
Hypokalaemia, hypocalcaemia and hypomagnesaemia all cause QTc prolongation.
Additional changes for hypokalaemia:
- Tall P waves
- PR prolongation
- U waves (can be hard to spot)
- ST depression and T wave flattening / inversion
- QTc prolongation
Drug Toxicity
There are 2 main drug toxicity-related ECG changes one should be aware of.
Tricyclic Antidepressant (TCA) Toxicity
ECG features:
- QRS widening (>3 small boxes)
- QTc prolongation
Note that TCA toxicity lacks the tall, tented T waves in hyperkalaemia (as it can be easy to be mixed up with hyperkalaemia).
https://litfl.com/sodium-channel-blocker-toxicity-ecg-library/
© Life in the Fast Lane. Licensed under CC BY-NC 4.0
Digoxin Toxicity
ECG features:
- Downsloping ST depression with a characteristic “reverse tick” appearance
- Flattened / inverted / biphasic T waves
- QTc shortening
The reverse tick downsloping ST depression is most prominent at lead II.
© Life in the Fast Lane. Licensed under CC BY-NC 4.0
Related Articles
Tachycardia (Peri-Arrest) Management
Cardiac Arrest and Advanced Life Support (ALS)